Fig. 1
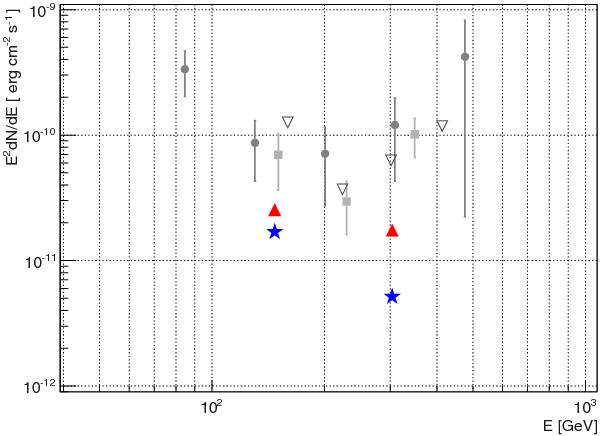
Differential upper limits calculated from MAGIC observations from the two individual observations periods in 2011 (blue stars for February–April upper limits, red filled triangles for June upper limits). Previous MAGIC-I observations are also shown (Aleksić et al. 2011b): the 2006 discovery (grey circles), 2007 detection (grey squares), and the upper limits derived from the 2009 observations (grey open down-pointing triangles). All observations are corrected for EBL absorption using Domínguez et al. (2011).
Current usage metrics show cumulative count of Article Views (full-text article views including HTML views, PDF and ePub downloads, according to the available data) and Abstracts Views on Vision4Press platform.
Data correspond to usage on the plateform after 2015. The current usage metrics is available 48-96 hours after online publication and is updated daily on week days.
Initial download of the metrics may take a while.