Fig. 9
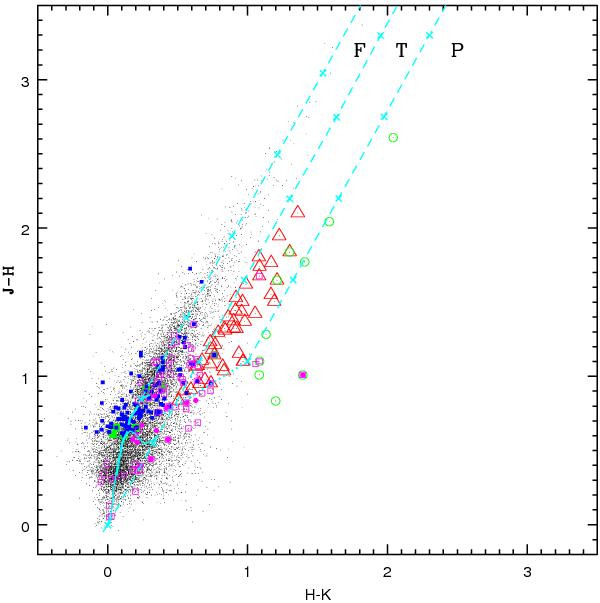
(J − H) / (H − K) color–color diagram of sources detected in the JHKs bands in the CrW region. The sequences of dwarfs (solid curve) and giants (thick dashed curve) are from Bessell & Brett (1988). The dotted line represents the locus of T Tauri stars (Meyer et al. 1997). Parallel dashed straight lines represent the reddening vectors (Cohen et al. 1981). The crosses on the dashed lines are separated by AV = 5 mag. YSOs are also shown. Open magenta squares = Spitzer; filled magenta circles = Hα; filled squares = X-ray emitting WTTSs (green = XMM-Newton, blue = Chandra); open red triangles = CTTSs and open green circles = probable NIR-excess sources (see text for the classification scheme).
Current usage metrics show cumulative count of Article Views (full-text article views including HTML views, PDF and ePub downloads, according to the available data) and Abstracts Views on Vision4Press platform.
Data correspond to usage on the plateform after 2015. The current usage metrics is available 48-96 hours after online publication and is updated daily on week days.
Initial download of the metrics may take a while.