Fig. 8
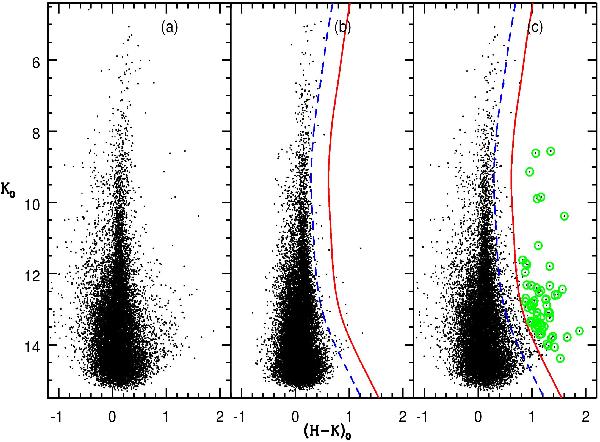
K0/ (H − K)0 CMD for a) stars in the CrW region, b) stars in the field region and c) same stars as in panel a) along with identified probable NIR-excess stars. The blue dashed line represents the envelope of field CMD, whereas the red solid line demarcates the distribution of IR excess sources from MS stars.
Current usage metrics show cumulative count of Article Views (full-text article views including HTML views, PDF and ePub downloads, according to the available data) and Abstracts Views on Vision4Press platform.
Data correspond to usage on the plateform after 2015. The current usage metrics is available 48-96 hours after online publication and is updated daily on week days.
Initial download of the metrics may take a while.