Fig. 6
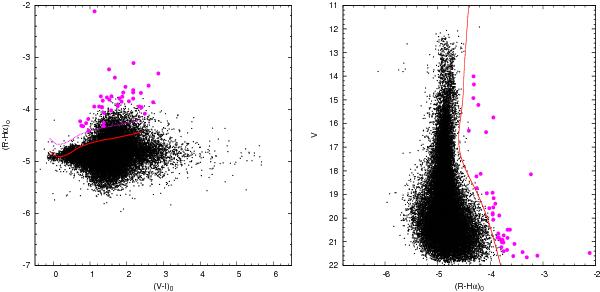
Left panel: (R − Hα)0 index as a function of the (V − I)0 color. The solid line indicates the relation for MS stars as taken from Sung et al. (1997). The dashed line (magenta) yields the thresholds for Hα emitter candidates. Right panel: V versus (R − Hα)0 CMD. The magenta circles represent Hα emitter candidates. An envelope as discussed in Sect. 4.2.1 is indicated by a solid line.
Current usage metrics show cumulative count of Article Views (full-text article views including HTML views, PDF and ePub downloads, according to the available data) and Abstracts Views on Vision4Press platform.
Data correspond to usage on the plateform after 2015. The current usage metrics is available 48-96 hours after online publication and is updated daily on week days.
Initial download of the metrics may take a while.