Fig. 15
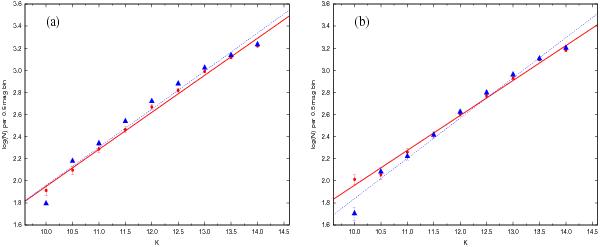
a) Comparison between the observed KLF in the reference field (red
filled circles) and the simulated KLF from star counts modeling (blue filled
triangles). If the star counts represent the number N of stars in a bin, the
associated error bars are  .
The KLF slope (α, see Sect. 4.5) of the reference field (solid line) is 0.34 ± 0.01. The simulated model
(dashed line) also gives the same value of slope (0.34 ± 0.02). b) The KLF
for the CrW region (filled red circles) and the simulated star counts (blue filled
triangles). In the magnitude range 10.5−14.25, the best-fit KLF slope (α) for the CrW region
(solid line) is 0.31 ±
0.01, whereas for the model (dashed line), after taking
extinction into account, it comes out to be 0.36 ± 0.02.
.
The KLF slope (α, see Sect. 4.5) of the reference field (solid line) is 0.34 ± 0.01. The simulated model
(dashed line) also gives the same value of slope (0.34 ± 0.02). b) The KLF
for the CrW region (filled red circles) and the simulated star counts (blue filled
triangles). In the magnitude range 10.5−14.25, the best-fit KLF slope (α) for the CrW region
(solid line) is 0.31 ±
0.01, whereas for the model (dashed line), after taking
extinction into account, it comes out to be 0.36 ± 0.02.
Current usage metrics show cumulative count of Article Views (full-text article views including HTML views, PDF and ePub downloads, according to the available data) and Abstracts Views on Vision4Press platform.
Data correspond to usage on the plateform after 2015. The current usage metrics is available 48-96 hours after online publication and is updated daily on week days.
Initial download of the metrics may take a while.