Fig. 14
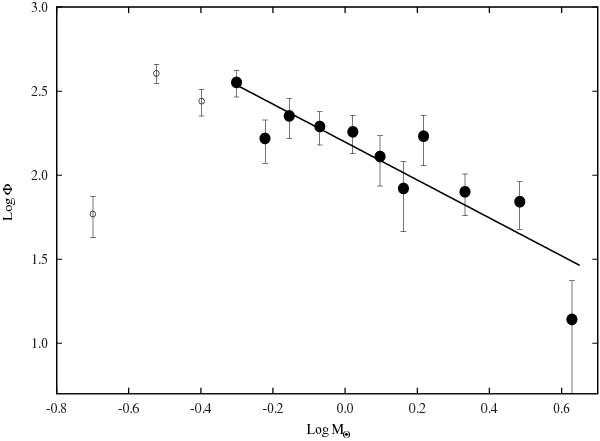
Plot of the mass function in the CrW region. Log Φ represents logN(log m). The error bars
represent  errors. The solid line shows a least-squares fit over the entire mass range
0.5
<M/M⊙<
4.8. Open and filled circles represent the points below and above
the completeness limit of our data, respectively.
errors. The solid line shows a least-squares fit over the entire mass range
0.5
<M/M⊙<
4.8. Open and filled circles represent the points below and above
the completeness limit of our data, respectively.
Current usage metrics show cumulative count of Article Views (full-text article views including HTML views, PDF and ePub downloads, according to the available data) and Abstracts Views on Vision4Press platform.
Data correspond to usage on the plateform after 2015. The current usage metrics is available 48-96 hours after online publication and is updated daily on week days.
Initial download of the metrics may take a while.