Fig. 13
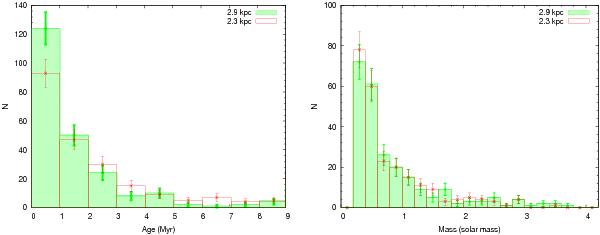
Distribution of YSOs ages (left panel) and masses (right
panel) in the observed region. The green and red histograms are for the
estimated ages and masses of YSOs assuming a distance of 2.9 kpc and 2.3 kpc,
respectively. The error bars along ordinates represent
 Poisson errors.
Current usage metrics show cumulative count of Article Views (full-text article views including HTML views, PDF and ePub downloads, according to the available data) and Abstracts Views on Vision4Press platform.
Data correspond to usage on the plateform after 2015. The current usage metrics is available 48-96 hours after online publication and is updated daily on week days.
Initial download of the metrics may take a while.