| Issue |
A&A
Volume 567, July 2014
|
|
|---|---|---|
| Article Number | A113 | |
| Number of page(s) | 8 | |
| Section | Astrophysical processes | |
| DOI | https://doi.org/10.1051/0004-6361/201322205 | |
| Published online | 23 July 2014 | |
PKS 1510-089: a rare example of a flat spectrum radio quasar with a very high-energy emission
1
Nicolaus Copernicus Astronomical Center,
00-716
Warsaw,
Poland
e-mail:
This email address is being protected from spambots. You need JavaScript enabled to view it.
2
Harvard-Smithsonian Center for Astrophysics,
Cambridge
MA
02138,
USA
3
CEA Irfu, Centre de Saclay, 91191
Gif-sur-Yvette,
France
4
Deutsches Elektronen-Synchrotron (DESY),
Platanenallee 6,
15738
Zeuthen,
Germany
5
Landessternwarte, Universitat Heidelberg,
Konigstuhl 69117,
Heidelberg,
Germany
Received:
4
July
2013
Accepted:
18
May
2014
Abstract
Context. The blazar PKS 1510-089 is an example of flat spectrum radio quasars. High-energy emissions from this class of objects are believed to have been produced by IC radiation with seed photons originating from the broad line region. In such a paradigm, a lack of very high-energy emissions is expected because of the Klein-Nishina effect and strong absorption in the broad line region. Recent detection of at least three such blazars by Cherenkov telescopes has forced a revision of our understanding of these objects.
Aims. We have aimed to model the observed spectral energy distribution of PKS 1510-089 from the high-energy flares in March 2009, during which very high-energy emission were also detected by H.E.S.S.
Methods. We have applied the single-zone internal shock scenario to reproduce the multiwavelength spectrum of PKS 1510-089. We have followed the evolution of the electrons as they propagate along the jet and emit synchrotron and IC radiation. We have considered two sources of external photons: the dusty torus and the broad line region. We have also examined the effects of the gamma-gamma absorption of the high-energy photons both in the AGN environment (the broad line region and the dusty torus), as well as while traveling over cosmological distances: the extragalactic background light.
Results. We have successfully modeled the observed spectrum of PKS 1510-089. In our model, the highest energy emission is the result of the Comptonization of the infrared photons from the dusty torus, thus avoiding Klein-Nishina regime, while the bulk of the emissions in the GeV range may still be dominated by the Comptonization of radiation coming from the broad line region.
Key words: galaxies: jets / galaxies: active / quasars: individual: PKS 1510-089
© ESO, 2014
1. Introduction
The observations by the Fermi/LAT instrument in the high-energy (HE: 100 MeV < E < 100 GeV) range resulted in an identification of 1873 sources (Nolan et al. 2012). Most of these sources are blazars, which are very luminous, active galactic nuclei (AGNs) with relativistic jets pointing toward the observer.
The broadband spectrum of blazars is dominated by non-thermal emissions produced in a relativistic jet (Blandford & Rees 1978). The spectral energy distribution (SED) of blazars is characterized by two, broad spectral components. A low-energy component extends from the radio to optical/UV/X-rays, and is produced by the synchrotron radiation of relativistic electrons. The high-energy component may extend from X-rays to γ rays and, according to recent interpretations, is produced by IC (IC) radiation with a possible source in seed photons, being either the synchrotron radiation, the broad line region (BLR), or the dusty torus (DT).
Blazars can roughly be divided into two classes: flat spectrum radio quasars (FSRQs) and BL Lac objects; FSRQs are distinguished by the presence of broad emission lines, which are absent or very weak in BL Lac objects.
The high-energy component of FSRQs is usually much more luminous than the low-energy one. The seed photons for IC radiation most probably come from regions external to the jet (Sikora et al. 1994; Błażejowski et al. 2000). The high-energy component of BL Lac objects results from the Comptonization of synchrotron photons. The luminosity at the peak of the high-energy component is comparable or lower than the synchrotron peak luminositiy (Blandford & Rees 1978).
If the high-energy component is produced by an IC scattering of photons reprocessed in the BLR, then the spectra of FSRQs should have a cut-off at a few GeV due to the Klein-Nishina (KN) effect (Moderski et al. 2005). Spectral breaks at a few GeV have been found in many FSRQs (Abdo et al. 2011). The most prominent example is 3C 454.3 (Abdo et al. 2009). In addition, the luminous IR-UV photon fields from the BLR or the DT can cause a strong absorption of HE and very high-energy (VHE: >100 GeV) photons by electron-positron pair production (Donea & Protheroe 2003; Liu & Bai 2006). This mechanism was proposed by Poutanen & Stern (2010) to explain the observed spectral features in several blazars.
Despite a large number of FSRQs detected in the HE range, almost all blazars observed in the VHE range belong to the BL Lac class of objects (Errando et al. 2012). Recently, however, Cherenkov telescopes have detected three FSRQs in the sub-TeV range. The first detected object was 3C 279, observed with the MAGIC Telescope (Aleksić et al. 2011a). Two additional FSRQs are 4C 21.35, detected by the MAGIC Telescope (Aleksić et al. 2011b), and PKS 1510-089, detected with H.E.S.S. (Hauser et al. 2011; Wagner & et al. 2010). The detection of these objects proved that FSRQs can also emit photons in the VHE range.
This VHE emission is very difficult to explain within the current models of FSRQs, which assume that the γ-ray emitting region is close to the base of the jet, within distances up to 10-2 pc, where the strong external photon field originating from the BLR is present. We investigate impacts of the location of the emitting region on the SED. In particular, we focus on the impact of an environment on the jet, such as external photon fields, the γ − γ absorption, and the Klein-Nishina effects.
The paper is organized as follows. In Sect. 2, we describe general properties of PKS 1510-089. In Sect. 3, we report the results of the monitoring on the source during its flaring activity in March 2009, together with simultaneous multiwavelength observations across the electromagnetic spectrum. In Sect. 4, we present the SED modeling and discuss the absorption, as well as the location of the γ-ray emitting region in the jet of PKS 1510-089. The discussion and conclusions are presented in Sects. 5.
2. Blazar PKS 1510-089
Blazar PKS 1510-089 (αJ2000 = 15h12m50.5s, δJ2000 = −09d06m00s), at a redshift of z = 0.361, is a FSRQ detected in the MeV-GeV band by the EGRET detector (Hartman et al. 1999). It is characterized by a highly relativistic jet that makes a ~3° angle relative to the line of sight (Wardle et al. 2005). The radio jet of PKS 1510-089 is curved and shows an apparent superluminal motion as high as 45 times the speed of light (Homan et al. 2001, 2002; Jorstad et al. 2005).
The first large multiwavelength campaign on PKS 1510-089 took place in August 2006 (Kataoka et al. 2008) and involved the Suzaku and Swift satellites, as well as ground-based optical and radio instruments. The campaign allowed the construction of the broadband spectrum of the object, ranging from 109 to 1019 Hz. The spectrum was successfully modeled using the one-zone internal shock scenario. Kataoka et al. (2008) focused their work on the explanation of the X-ray part of the SED, where an excess of emissions has been observed. If interpreted as bulk-Compton radiation, this excess allows an estimate of the pair content of the jet. In the case of PKS 1510-089, the ratio of e+e− pairs to the number of protons was estimated to be on the order of 10. This implies that although the number of e+e− pairs is larger than the number of protons, the power of the jet is still dominated by the latter. As an alternative interpretation, Kataoka et al. (2008) proposed that the observed soft X-ray excess might be explained as a contribution of the synchrotron self-Compton (SSC) component, which, although energetically inefficient, shows its presence in the soft X-ray range.
Abdo et al. (2010) have reported on multiwavelength observations of PKS 1510-089 during a high activity period between September 2008 and July 2010. These observations revealed a complex variability in optical, UV, X-ray, and γ-ray bands of time scaled down to 6–12 h. The study of the correlation of the variability in different energy ranges, performed by Abdo et al. (2010), shows lack of a correlation between the γ rays and the X-rays, a weak correlation between the γ rays and the UV(R) band, and a significant correlation of γ rays with the optical band. Abdo et al. (2010) attempted to model three distinctive flares observed during the period with simultaneous data from radio to γ-ray energies. They adopted the IC scenario with seed photons originating from the BLR to explain the HE emission. The emission region in their model was assumed to be located within the subparsec scale. A significant fraction of the IC scattering in their model occurred in the KN regime leading to the curved MeV/GeV spectral shape that matches the observed spectrum in the HE range.
A multiwavelength campaign in a quiescent state of PKS 1510-089 was conducted in 2011 (Nalewajko et al. 2012). The campaign included Herschel observations combined with the data publicly available from the Fermi/LAT, Swift/XRT, SMARTS, and the Submillimeter Array (SMA). Nalewajko et al. (2012) concluded that at least a two-zone blazar model is necessary to interpret the entire dataset. They suggested that the observed infrared emission is associated with the synchrotron component produced in the hot-dust region. To explain the γ-ray emission, they proposed an IC component produced in the BLR. Both components were located within the subparsec scale. In such a scenario, the optical/UV emission would be associated with the accretion disk thermal emission, with the accretion disk corona likely contributing to the X-ray emission. Nalewajko et al. (2012) demonstrated that a single-zone scenario would require an unrealistically high-energy density of the external radiation to explain the observed data and, in particular, the Compton dominance.
Most recently, Saito et al. (2013) investigated the γ-ray light curve of the source obtained with Fermi/LAT during the period from September to December 2011. They found a variety of temporal characteristics and variability patterns, e.g., very rapid flares with doubling times of 1 h and an energy release comparable to the kinetic luminosity of the jet.
3. Observations
In March 2009, a flaring activity of PKS 1510-089 was reported in the high-energy range (D’Ammando et al. 2009; Pucella et al. 2009; Vercellone et al. 2009). The flaring activity was also detected by the ATOM telescope and the GASP project (Villata et al. 2009). Observations with the H.E.S.S. telescopes followed the reporting of this flaring activities. In this work we used the H.E.S.S. and Fermi/LAT spectrum published by H.E.S.S. Collaboration (Abramowski et al. 2013b), which covers two periods. The majority of VHE emissions was detected during the first period. The Fermi/LAT spectrum is obtained for the time period simultaneous with the H.E.S.S. observations of PKS 1510-089.
3.1. H.E.S.S. observation
The H.E.S.S. data were taken simultaneously with the peak of the HE flare recorded by Fermi/LAT. The H.E.S.S. Collaboration carried out observations of PKS 1510-089 in two periods. The first observations were taken between 23 March 2009 (MJD 54 910) and 2 April 2009 (MJD 54 923). The second report of the HE activity triggered the H.E.S.S. observations between 27 April 2009 (MJD 54 948), and 29 April 2009 (MJD 54 950). The H.E.S.S. observations resulted in 15.8 h of good-quality data. The spectrum in the energy range from 0.15 TeV to 1 TeV is well represented by the power-law function with a spectral index of Γ = 5.4 ± 0.7stat ± 0.3sys. The integral flux corresponds to ≈3% of the Crab Nebula, or, equivalently I(0.15 TeV < E < 1.0 TeV) = (1.0 ± 0.2stat ± 0.2sys) × 10-11 cm-2 s-1 (Abramowski et al. 2013b).
3.2. Fermi/LAT data analysis
The Fermi/LAT (Atwood et al. 2009) data, simultaneously with the H.E.S.S. observations, were published by the H.E.S.S. Collaboration (Abramowski et al. 2013b). The light curve between MJD 54 909.5 and MJD 54 951.5 shows two evident flares, one centered around MJD 54 916, and the other centered around MJD 54 948.
The HE data taken between MJD 54 914.8 and MJD 54 917.5 were best fitted by the log-parabola model dN/ dE = n0(E/E0)−α−βln(E/E0), with the following parameters: a normalization n0 = (10.5 ± 0.7) × 10-9 cm-2 s-1 MeV-1, slope parameters of α = 1.81 ± 0.13 and β = 0.161 ± 0.048, and the energy E0 fixed at 260 MeV.
3.3. RXTE, Swift, optical and radio data
The RXTE light curve and spectrum, as well as the radio data, were presented in Marscher et al. (2010).
The Swift/XRT spectrum in the period corresponding to the H.E.S.S. observations (MJD 54 910–54 923) was produced using the Build Swift/XRT Products tool (Evans et al. 2009). The resulting Swift/XRT spectrum is accurately described by a power law with photon index 1.45 ± 0.03. The galactic absorption with a hydrogen column density of 6.89 × 1020 cm-2 was assumed (Kalberla et al. 2005).
The optical observations have been carried out with the ATOM telescope located on the H.E.S.S. site and operated by the H.E.S.S. Collaboration. PKS 1510-089 is one of the sources regularly observed with the ATOM. The maximum optical flux of 5.724 ± 0.150 mJy was observed by the ATOM in the R band in March 2009 (Abramowski et al. 2013b).
The radio data during the flare were recorded through the Michigan Radio Astronomy Observatory (14.5 GHz), the Metsähovi Radio Observatory (37 GHz), and the Submillimeter Array (230 GHz) and are presented in Marscher et al. (2010).
4. Modeling
We have aimed to reproduce the SED of PKS 1510-089 during the HE state recorded in March 2009, during which emission VHE were also detected by H.E.S.S. telescopes. Our approach was to use the one-zone leptonic model implemented in the BLAZAR code (Moderski et al. 2003).
The BLAZAR code models non-thermal flares following the evolution of relativistic electrons injected into the conical jet as a result of shock operation. The shock forms during the collision of inhomogenities propagating down the jet with different velocities. Such inhomogenities may be created by some instabilities in the very central part of the AGNs. In the absence of a detailed model of particle acceleration the injected distribution of particles is assumed to be a broken power law. The injected particles then lose their energy because of synchrotron and IC emission as well as adiabatic cooling.
The BLAZAR code requires some input parameters, notably the value of the energy density of an external diffuse radiation field, the injected electron energy distribution, the value of the magnetic field, and the description of the overall geometry of the emitting region.
The parameters of these external photon fields, used as the input, are estimated based on the observations and known relations (see Sect. 4.1). The choice of geometry, mainly opening and viewing angles, and the Doppler factor are in first approximation motivated by observations, and then are tuned to best reproduce the overall SED. The localization of the emitting region is obtained by combining various effects, thus our choice is strongly constrained by observations (see Sects. 4.2.1 and 4.3). The value of the magnetic field and the electron distribution cannot be constrained directly, but can be found from the modeling of the SED. The modeling of simultaneous multiwavelength data, as in the case of the 2009 active state of PKS 1510-089, provides the best tool for constraining the values of the magnetic field and the electron energy distribution.
The next sections present the model parameters and introduce two effects that are important for modeling of FSRQs at high-energies, namely absorption of high-energy photons in a process of pair production and the Klein-Nishina effect. Later in this section we discuss the location of the region where the bulk of the HE emission is produced, the so-called blazar zone, and present the obtained SED of the object.
4.1. Model parameters
The BLAZAR code calculates the evolution of electrons injected
along the jet. The injected electrons follow a broken power-law distribution,
 (1)where
Ke is the normalization of the injection
function, p
and q are
low- and high-energy electron spectral indices, and γb,
γmin, and γmax are break,
minimum, and maximum electron Lorentz factors, respectively.
(1)where
Ke is the normalization of the injection
function, p
and q are
low- and high-energy electron spectral indices, and γb,
γmin, and γmax are break,
minimum, and maximum electron Lorentz factors, respectively.
The electron injection starts at some distance R0 from the center and continues until R = 2R0, while the electron evolution is followed up to 3R0. The proper choice of R0 is crucial for the SED modeling. The luminosity of the accretion disk has been reported by Nalewajko et al. (2012) to be Ld = 5 × 1045 erg s-1.
Two sources of external photons, DT and BLR, were considered. Following the equation
(Pian et al. 2005) ![Mathematical equation: \begin{eqnarray} R_{\mathrm{BLR}}=(22.4\pm0.8) \left [ \frac{\lambda L_{\lambda}(1350~\mbox{\AA})}{10^{44}~\mbox{erg\,s}^{-1}} \right ]^{0.61\,\pm\,0.02} \, \text{light-days}, \label{eq:RBLR} \end{eqnarray}](/articles/aa/full_html/2014/07/aa22205-13/aa22205-13-eq39.png) (2)the
size of the BLR, RBLR, is estimated to be 0.12 × 1018 cm. The dust
temperature is T = 1.8
T3, where T3 = 1000 K
(Nalewajko et al. 2012). The size of the DT is
approximately RDT ≃
1.94 × 1018 cm (see Eq. (39) in Sikora et al. 2009).
(2)the
size of the BLR, RBLR, is estimated to be 0.12 × 1018 cm. The dust
temperature is T = 1.8
T3, where T3 = 1000 K
(Nalewajko et al. 2012). The size of the DT is
approximately RDT ≃
1.94 × 1018 cm (see Eq. (39) in Sikora et al. 2009).
The energy density of the magnetic field, B, is defined as uB =
B2/ 8π
(see Table 1). The energy density of external
radiation fields have been calculated using the equation (Sikora et al. 2009)  (3)where
“ext” can be either DT or
BLR, and ξext is a fraction of reprocessed emission
from the accretion disk. We adopted nBLR = 3 and nDT = 4 (Sikora et al. 2009; Nalewajko et al. 2012; Hayashida et al.
2012). The corresponding energy density in the jet comoving frame is approximated
as u′ = 4
/ 3Γ2uext.
(3)where
“ext” can be either DT or
BLR, and ξext is a fraction of reprocessed emission
from the accretion disk. We adopted nBLR = 3 and nDT = 4 (Sikora et al. 2009; Nalewajko et al. 2012; Hayashida et al.
2012). The corresponding energy density in the jet comoving frame is approximated
as u′ = 4
/ 3Γ2uext.
We have used ξBLR ≈ 0.1 and ξDT ≈ 0.2. The values of ξBLR,DT together with values of Ld, RBLR,DT listed above, give the density of external radiation fields at a distance 2R0, uBLR ≈ 0.09 erg cm-3 and uDT ≈ 0.0005 erg cm-3, where R0 is the distance from the central engine to the point where the electron injection starts (see Table 1). The distribution of the energy density of the photon fields as a function of distance is presented in Fig. 1.
We assumed a jet Lorentz factor of Γ = 22 and with the jet opening angle, θjet, related as 1/Γ. The jet opening angle is then ≈2.6° (see Table 1). The object is observed at θobs = θjet, which is consistent with observations (Wardle et al. 2005).
4.2. Absorption
The fundamental process responsible for the absorption of HE γ rays is the electron-positron pair production.
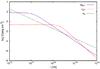 |
Fig. 1 Energy density of the extended fields as a function of the distance from the central source. The energy density is given in the jet comoving frame. The solid violet line represents the energy density of BLR, the dashed red line the energy density of DT, and the dash-dotted green line the energy density of magnetic field. |
Input parameters for modeling of the non-thermal emission of the PKS 1510-089.
The observed HE spectrum after attenuation is
 (4)where
e−τ(E) is the attenuation,
τ(E) is the optical depth, and
Fint is the intrinsic spectrum of the
source. The optical depth given by Gould &
Schréder (1967) is
(4)where
e−τ(E) is the attenuation,
τ(E) is the optical depth, and
Fint is the intrinsic spectrum of the
source. The optical depth given by Gould &
Schréder (1967) is  (5)where
dl is the
differential path traveled by the HE photon, θ is the angle between the momenta of HE and
low-energy (LE) photons, and Eth is a threshold energy for pair
production. The energy of the HE photon is E and the energy of the LE photon is
ϵ. The
density number of the LE photons is n(ϵ) cm-3. The cross-section
σ(E,ϵ,cosθ) of
pair production is given by Bi & Yuan
(2008).
(5)where
dl is the
differential path traveled by the HE photon, θ is the angle between the momenta of HE and
low-energy (LE) photons, and Eth is a threshold energy for pair
production. The energy of the HE photon is E and the energy of the LE photon is
ϵ. The
density number of the LE photons is n(ϵ) cm-3. The cross-section
σ(E,ϵ,cosθ) of
pair production is given by Bi & Yuan
(2008).
High-energy photons can be absorbed by several photon fields during their travel from the emission region to the observer. The first sources of LE photons are located in the blazar itself (internal absorption). Then, when photons escape from the blazar, they travel over cosmological distances and may be absorbed by LE photons of the extragalactic background light (external absorption).
4.2.1. Internal absorption
The first possibility of absorption arises from the photon fields present in the blazar itself. When a HE photon is produced in the jet within the BLR radius, it has to travel through the combined photon fields of BLR and DT. The characteristic frequency of the BLR radiation is on the order of 10 eV (Kataoka et al. 2008), while the characteristic frequency of DT is on the order of 0.1 eV (Nalewajko et al. 2012). Since the energy of BLR photons is larger than that of DT photons, the threshold energy of pair production is smaller for the BLR and HE photons are absorbed above energies of a few GeV. Specifically, at a distance R = 1017 cm (just inside RBLR) the attenuation for 200 GeV photons due to internal absorption is ≈0.1.
To avoid significant absorption by BLR photons, the blazar zone, where HE photons are emitted, has to be located outside the BLR. The photon number density of external radiation (from both BLR and DT) decreases with distance as in Eq. (3). When HE photons propagate inside the BLR or DT region then the distribution of the photon field is isotropic and therefore the cosθ in Eq. (5) ranges from −1 to 1. However, outside of the BLR or DT regions, θ have values ranging from θmin = π + arctan(RBLR,DT/r) to θmax = π − arctan(RBLR,DT/r).
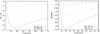 |
Fig. 2 Internal absorption as a function of photon energy emitted in the blazar zone. The values of attenuation presented for BLR, e− τ(E), are calculated for different distances from the center and assuming the PKS 1510-089 model parameters listed in Table 1. Left panel: R0 below RBLR. Right panel: R0 above RBLR. |
Figure 2 shows the internal absorption caused by photons from BLR, e−τ(E), as a function of the photon energy.
The internal absorption caused by photons from the DT is significant for γ-ray photons with energies above 400 GeV and can thus be ignored in further investigation because the emissions detected during the 2009 flare by H.E.S.S. is in sub-TeV range.
4.2.2. External absorption
The other source of LE photons is the extragalactic background light (EBL). The EBL is the IR/UV radiation generated by stars (UV) and radiation emitted through the absorption and re-emission of star light by dust in galaxies (IR). The EBL models have been reviewed recently by, e.g., Hauser & Dwek (2001) and new constraints on the EBL intensity have been provided by Meyer et al. (2012) using the Fermi/LAT data and Abramowski et al. (2013a) using the H.E.S.S. observations of the brightest blazars.
In the case of EBL, the energy of HE photon, E, as well as the energy of LE photon, ϵ, have to be multiplied by (1 + z), where E and ϵ are the observed photon energies at z = 0. The distribution of angles, θ, at which background photons can collide with HE photons is flat when a photon is traveling over cosmological distances; therefore, the cosθ of the scattering angle (see Eq. (5)) changes from −1 to 1.
The EBL model of Franceschini et al. (2008) has been used in our modeling of PKS 1510-089.
4.3. Location of the γ-ray emitting region in PKS 1510-089
The choice of the distance of the shock formation from the central source, R0, is constrained on the one hand by the internal absorption of γ rays in BLR, and on the other hand by the IC efficiency. When R0 is smaller than RBLR, a significant fraction of the HE radiation (from several dozen to several hundred GeV) is absorbed. If R0 is greater than RBLR, then only a few percent of the HE emission is absorbed.
If, however, the blazar zone is too far away from the BLR then the photon energy density is too small to produce the observed γ-ray emission by IC mechanism.
There is some observational evidence that the blazar zone in PKS 1510-089 may be located outside the BLR. The radio observations of PKS 1510-089 between 9 September 2011, and 17 October 2011, show a Δtobs ~ 40 day increase in radio flux (Orienti et al. 2013). If the γ-ray flare is associated with the same region as the radio flare, the projected distance between the regions where the shock formed and the site responsible for the γ-ray emission is ~0.6 pc (Orienti et al. 2013). Assuming a jet inclination angle of θjet ~ 3° (Marscher et al. 2010), the deprojected distance is about ≃10 pc. This demonstrates that at least for some γ-ray flares, the blazar zone may be located far outside the BLR.
In the modeling of PKS 1510-089 presented, we adopted R0 = 0.7 × 1018 cm. At that distance, the absorption by the low-energy photons originating from the BLR is very small, less than 1%, while the energy density (see Fig. 1) in the blazar zone of PKS 1510-089 (0.7−1.4 × 1018 cm) is still dominated by radiation from the BLR. Outside RBLR, the external radiation field is dominated by uBLR up to a distance RDT, where uBLR becomes comparable to the energy density of the radiation from DT.
In the considered scenario, the blazar zone is placed outside the BLR, thus the radiation form BLR comes from behind the outflowing plasma jet. The IC energy losses are smaller here than in the isotropic external radiation fields (Ghisellini & Tavecchio 2009; Sikora et al. 2013). The impact of the direction of the radiation field on the observed SED is currently being investigated (Moderski & Bhatta, in prep.).
4.4. Klein-Nishina effect
When the product of the energy of the photon and the energy of the electron before the
collision γϵ
is ≪1, where γ is the electron Lorentz
factor and ϵ =
hν/
(mec2), the
interaction proceeds in the so-called Thomson regime. In this regime, the rate of IC
energy losses of relativistic, isotropically distributed electrons is  (6)where
u0 is the total energy density of the
radiation field.
(6)where
u0 is the total energy density of the
radiation field.
However, in the case of HE emission in blazars, the photon energy may become comparable
or even larger than the electron energy (γϵ > 1). In such a case the
cross-section has to be expressed using the full Klein-Nishina (KN) formula (Moderski et al. 2005). The cross-section is smaller
here than in the Thomson regime as the photon energy becomes larger. One of the
consequences is a reduction of the electron energy loss rate  (7)where
 is given by Eq. (6) and a factor
FKN is given by Moderski et al. (2005).
is given by Eq. (6) and a factor
FKN is given by Moderski et al. (2005).
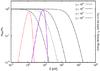 |
Fig. 3 Klein-Nishina correction factor, σKN/σT, as a function of the photon energy for different electron Lorentz factors, γ (black lines). The blue and red lines represent the energy densities of two external photon fields, BLR and DT, respectively, transformed into the jet comoving frame. |
Figure 3 presents the Klein-Nishina (KN) correction (a ratio of the Klein-Nishina cross-section to the Thomson cross-secton σKN/σT) as a function of the external photon energy for different electron Lorentz factors γ. The KN correction is presented together with the radiation of the BLR and the DT approximated as blackbody radiation and transformed into the jet comoving frame. Since the electrons with Lorentz factors above 103 are responsible for the HE and VHE emissions it can be seen from the picture that most of the scattering of the BLR photons happens in the KN regime, while electrons with Lorentz factors up to 104 scatter DT photons while they are still in the Thompson regime.
The rate of IC energy losses of relativistic electrons, calculated according to Eq. (7), is shown in Fig. 4. For sufficiently large distances from the center (>1018 cm), high-energy electrons cool predominantly by the IC scattering of DT photons, even if the energy density of the BLR radiation field is comparable or higher than the energy density of the infrared photons (see Fig. 1).
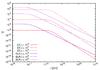 |
Fig. 4 Rate of IC energy losses of relativistic electrons. The IC cooling is presented for two sources of seed photons: BLR (violet lines) and DT (red lines). The cooling rate was calculated for different electron Lorentz factors γ: 1, 100, 10 000. |
4.5. Spectral energy distribution
The other model parameters are estimated to best reproduce the observed multiwavelength spectrum of PKS 1510-089. The parameters are summarized in Table 1. The overall spectrum of PKS 1510-089 is presented in Fig. 5. The green triangles in Fig. 5 represent the observations taken around the VHE flare in March 2009. The gray circles shows the data published by Kataoka et al. (2008). The gray squares are INTEGRAL data analyzed by Barnacka & Moderski (2009).
All discussed arguments suggest the following scenario for the PKS 1510-089 flaring activity recorded in March 2009:
-
the low-energy component is produced by the synchrotron radiation;
-
the high-energy part of the spectrum (from X-rays to VHE) consists of two components:
-
the first component is the IC radiation with seed photons originating from the BLR; this component dominates the emission in the Fermi range; because of the KN effect, this component alone cannot explain the highest part of the spectrum (>100 GeV);
-
the VHE emission is produced via IC scattering of the seed photons originating from DT; the same component is also responsible for the X-ray part of the spectrum, as in the previous modeling attempts of this object (Kataoka et al. 2008);
-
the modeled emission of PKS 1510-089 convolved with the EBL attenuation accurately fits the VHE emission.
5. Discussion and conclusions
In this work, we developed a single-zone model to explain the emission of PKS 1510-089 during the flare observed in March 2009. The distinct feature of models is the low-energy component produced by the synchrotron radiation and the high-energy component produced by the same population of ultra-relativistic electrons via an IC process. It has been confirmed that the Comptonization of photons coming from BLR alone cannot explain the VHE emission due to the KN effect, as anticipated by Moderski et al. (2005); VHE emission is accurately explained by the Comptonization of photons coming from the DT.
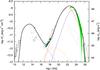 |
Fig. 5 Overall spectrum of PKS 1510-089. The short-dashed blue line represents the synchrotron component, the dashed red line is the inverse Compton (IC) component with seed photons originating from the dusty torus (DT) before absorption, and the dashed-dotted violet line is the IC radiation with seed photons originating from the broadband region (BLR). The dash-double-dotted orange line is the SSC component. The solid black line represents the sum of all the components, corrected for EBL absorption (see text for details) and absorption on the low-energy photons originating from the BLR and the DT. |
The recent attempt to model the observed spectrum of PKS 1510-089 was undertaken by Nalewajko et al. (2012), who analyzed the 2011 low state of the object. They used the data obtained with the Herschel satellite to constrain the theoretical models and concluded that a multizone emission model is necessary to explain the spectral properties of PKS 1510-089.
The fast optical flares observed in 2009 were significantly brighter and more strongly polarized than those observed in 2011.
Abdo et al. (2010) modeled the flares observed in 2009, but were unable to reproduce VHE emission due to assumption of BLR responsible for all HE emission.
The optical flaring activity in 2009 and 2011 might have been accompanied by an increase in the magnetic field. This is supported by the observation of a significant increase in the degree of optical polarization (Sasada et al. 2011) and observation of the emergence of superluminal knot with VLBA a 7 mm (Marscher et al. 2010) during the flare in 2009. This behavior of the low-energy component was not observed in 2011 when the Herschel data were taken.
The source PKS 1510-089 was detected with the H.E.S.S. system in March–April 2009 during the high state in the HE and optical domains. The observations revealed a VHE emission up to 400 GeV. Abdo et al. (2010) model the emission for energies below 100 GeV, without predictions for the VHE emission.
Our model provides interesting predictions for variability pattern observed at different wavelengths; for example, the HE and X-ray emission does not have to be correlated because the emission in these energy ranges is produced by different components. This lack of correlation between X-ray and HE was reported in the multiwavelength data presented by Abdo et al. (2010), who also report a positive correlation between the HE and optical band. The last correlation is a signature of a leptonic single-zone scenario in which optical and γ-ray emission is produced by the same population of electrons. Possible lack of correlation between HE and VHE can also be explained as due to different production mechanisms.
Marscher et al. (2010) demonstrated that the HE emission from the jet of PKS 1510-089 is quite complex. The emission arises from different regions and probably multiple emission mechanisms are involved. Such a complicated behavior may be a result of different locations of the blazar zone during different flares. A complicated interplay between the internal absorption of different spectral components in the HE and VHE ranges may lead to large differences in the observed correlation or lack of correlation at different wavelengths.
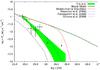 |
Fig. 6 H.E.S.S. observation of PKS 1510-089 and the model with and without absorption corrections. The shaded region shows the fit to the H.E.S.S. data at 68% confidence, and the points with error bars (1σ statistical errors) are the energy flux. Arrows denote the 99% confidence level. upper limits. Data taken from Abramowski et al. (2013b). The solid line represents the blazar model without internal and external absorption corrections. The long-dashed red line represents the blazar model after internal absorption correction. In the model proposed, where the blazar zone is located at a distance of ~1 pc, absorption in the BLR can be ignored. The absorption in the DT became significant at energies ~400 GeV, but the emissions, above these energies were not detected by H.E.S.S. in March 2009. The short-dashed blue line, the double-dot-dashed orange line, and the dash-dotted violet line represent the blazar model after internal absorption and external absorption using models provided by Franceschini et al. (2008), Gilmore et al. (2009), and Aharonian et al. (2006), respectively. |
The absorption of the HE and the VHE photons in the blazar itself has also been investigated. Figure 6 shows the blazar model with and without internal and external absorption corrections. Strong absorption of the VHE photons by the BLR photon field is avoided by locating the blazar zone outside the BLR. The absorption by photons from the DT and EBL absorption become significant only for photons with energies above 400 GeV. Such a highly energetic emission was not observed in the case of PKS 1510-089.
The EBL models given by Franceschini et al. (2008), Domínguez et al. (2011), and Kneiske & Dole (2010) have been used to analyze the absorption of VHE γ rays in intergalactic space. These models are not significantly distinguishable within the H.E.S.S. errorbars. For comparison, Fig. 6 shows the blazar model after internal absorption and external absorption using the models given by Franceschini et al. (2008), Gilmore et al. (2009), and Aharonian et al. (2006).
Very high-energy emission can be a common feature of FSRQs. Because of their high luminosity FSRQs can provide valuable targets for future VHE experiments. The H.E.S.S. II, with its energy range from tens of GeV, will provide a great opportunity to search for emission from other objects of this class.
In Abramowski et al. (2013b) the Fermi-HESS γ-ray spectrum was used to put constraints on the EBL level. In the model described here the assumption of a single-emission component for the entire γ-ray regime does not hold. However, if the VHE emission is measured while the source is in a low state in the Fermi-band, then it is plausible that the EC component from the torus dominates the VHE as well as the HE bands. In such a scenario the method used in Abramowski et al. (2013b) is still applicable.
Acknowledgments
We would like to thank the referee for the valuable comments. We would like to thank Jeff Grube for help with the Swift/XRT data analysis. This work was supported by the Polish Ministry of Science and Higher Education under Grants No. Dec-2011/01/N/ST9/06007. Part of this work was supported by the French national Program for High-Energy Astrophysics PNHE, and the French ANR project CosmoTeV.
References
- Abdo, A. A., Ackermann, M., Ajello, M., et al. 2009, ApJ, 699, 817 [NASA ADS] [CrossRef] [Google Scholar]
- Abdo, A. A., Ackermann, M., Agudo, I., et al. 2010, ApJ, 721, 1425 [NASA ADS] [CrossRef] [Google Scholar]
- Abdo, A. A., Ackermann, M., Ajello, M., et al. 2011, ApJ, 733, L26 [NASA ADS] [CrossRef] [Google Scholar]
- Abramowski, A., Acero, F., Aharonian, F., et al. 2013a, A&A, 550, A4 [NASA ADS] [CrossRef] [EDP Sciences] [Google Scholar]
- Abramowski, A., Acero, F., Aharonian, F., et al. (H.E.S.S. Collaboration) 2013b, A&A, 554, A107 [NASA ADS] [CrossRef] [EDP Sciences] [Google Scholar]
- Aharonian, F., Akhperjanian, A. G., Bazer-Bachi, A. R., et al. 2006, Nature, 440, 1018 [NASA ADS] [CrossRef] [PubMed] [Google Scholar]
- Aleksić, J., Antonelli, L. A., Antoranz, P., et al. 2011a, A&A, 530, A4 [NASA ADS] [CrossRef] [EDP Sciences] [Google Scholar]
- Aleksić, J., Antonelli, L. A., Antoranz, P., et al. 2011b, ApJ, 730, L8 [NASA ADS] [CrossRef] [Google Scholar]
- Atwood, W. B., Abdo, A. A., Ackermann, M., et al. 2009, ApJ, 697, 1071 [NASA ADS] [CrossRef] [Google Scholar]
- Barnacka, A., & Moderski, R. 2009, in Very High Energy Phenomena in the Universe, eds. J. Dumarchez, & J. Tran Thanh Van, 1, 111 [Google Scholar]
- Bi, X.-J., & Yuan, Q. 2008, unpublished [arXiv:0809.5124] [Google Scholar]
- Blandford, R. D., & Rees, M. J. 1978, in Proc. Conf. BL Lac Objects, ed. A. M. Wolfe (University of Pittsburgh), 328 [Google Scholar]
- Błażejowski, M., Sikora, M., Moderski, R., & Madejski, G. M. 2000, ApJ, 545, 107 [NASA ADS] [CrossRef] [Google Scholar]
- D’Ammando, F., Vercellone, S., Tavani, M., et al. 2009, ATel, 1957, 1 [NASA ADS] [Google Scholar]
- Domínguez, A., Primack, J. R., Rosario, D. J., et al. 2011, MNRAS, 410, 2556 [NASA ADS] [CrossRef] [Google Scholar]
- Donea, A.-C., & Protheroe, R. J. 2003, Astropart. Phys., 18, 377 [Google Scholar]
- Errando, M., et al. 2012 (VERITAS Collaboration), Fermi and Jansky Proceedings – eConf C1111101 [arXiv:1205.0068] [Google Scholar]
- Evans, P. A., Beardmore, A. P., Page, K. L., et al. 2009, MNRAS, 397, 1177 [NASA ADS] [CrossRef] [Google Scholar]
- Franceschini, A., Rodighiero, G., & Vaccari, M. 2008, A&A, 487, 837 [NASA ADS] [CrossRef] [EDP Sciences] [Google Scholar]
- Ghisellini, G., & Tavecchio, F. 2009, MNRAS, 397, 985 [NASA ADS] [CrossRef] [Google Scholar]
- Gilmore, R. C., Madau, P., Primack, J. R., Somerville, R. S., & Haardt, F. 2009, MNRAS, 399, 1694 [Google Scholar]
- Gould, R. J., & Schréder, G. P. 1967, Phys. Rev., 155, 1404 [NASA ADS] [CrossRef] [Google Scholar]
- Hartman, R. C., Bertsch, D. L., Bloom, S. D., et al. 1999, ApJS, 123, 79 [NASA ADS] [CrossRef] [Google Scholar]
- Hauser, M. G., & Dwek, E. 2001, ARA&A, 39, 249 [NASA ADS] [CrossRef] [Google Scholar]
- Hauser, M., Lenain, J. P., Wagner, S., & Hagen, H. 2011, ATel, 3509, 1 [NASA ADS] [Google Scholar]
- Hayashida, M., Madejski, G. M., Nalewajko, K., et al. 2012, ApJ, 754, 114 [NASA ADS] [CrossRef] [Google Scholar]
- Homan, D. C., Ojha, R., Wardle, J. F. C., et al. 2001, ApJ, 549, 840 [NASA ADS] [CrossRef] [Google Scholar]
- Homan, D. C., Wardle, J. F. C., Cheung, C. C., Roberts, D. H., & Attridge, J. M. 2002, ApJ, 580, 742 [NASA ADS] [CrossRef] [Google Scholar]
- Jorstad, S. G., Marscher, A. P., Lister, M. L., et al. 2005, AJ, 130, 1418 [NASA ADS] [CrossRef] [Google Scholar]
- Kalberla, P. M. W., Burton, W. B., Hartmann, D., et al. 2005, A&A, 440, 775 [NASA ADS] [CrossRef] [EDP Sciences] [Google Scholar]
- Kataoka, J., Madejski, G., Sikora, M., et al. 2008, ApJ, 672, 787 [NASA ADS] [CrossRef] [Google Scholar]
- Kneiske, T. M., & Dole, H. 2010, A&A, 515, A19 [NASA ADS] [CrossRef] [EDP Sciences] [Google Scholar]
- Liu, H. T., & Bai, J. M. 2006, ApJ, 653, 1089 [NASA ADS] [CrossRef] [Google Scholar]
- Marscher, A. P., Jorstad, S. G., D’Arcangelo, F. D., et al. 2010, Fermi Symp., eConf. Proc. C091122 [arXiv:1002.0806] [Google Scholar]
- Meyer, M., Raue, M., Mazin, D., & Horns, D. 2012, A&A, 542, A59 [NASA ADS] [CrossRef] [EDP Sciences] [Google Scholar]
- Moderski, R., Sikora, M., & Błażejowski, M. 2003, A&A, 406, 855 [NASA ADS] [CrossRef] [EDP Sciences] [Google Scholar]
- Moderski, R., Sikora, M., Coppi, P. S., & Aharonian, F. 2005, MNRAS, 363, 954 [NASA ADS] [CrossRef] [Google Scholar]
- Nalewajko, K., Sikora, M., Madejski, G. M., et al. 2012, ApJ, 760, 69 [NASA ADS] [CrossRef] [EDP Sciences] [Google Scholar]
- Nolan, P. L., Abdo, A. A., Ackermann, M., et al. 2012, ApJS, 199, 31 [NASA ADS] [CrossRef] [Google Scholar]
- Orienti, M., Koyama, S., D’Ammando, F., et al. 2013, MNRAS, 428, 2418 [Google Scholar]
- Pian, E., Falomo, R., & Treves, A. 2005, MNRAS, 361, 919 [NASA ADS] [CrossRef] [Google Scholar]
- Poutanen, J., & Stern, B. 2010, ApJ, 717, L118 [Google Scholar]
- Pucella, G., D’Ammando, F., Tavani, M., et al. 2009, ATel, 1968, 1 [NASA ADS] [Google Scholar]
- Saito, S., Stawarz, Ł., Tanaka, Y. T., et al. 2013, ApJ, 766, L11 [NASA ADS] [CrossRef] [Google Scholar]
- Sasada, M., Uemura, M., Fukazawa, Y., et al. 2011, PASJ, 63, 489 [NASA ADS] [Google Scholar]
- Sikora, M., Begelman, M. C., & Rees, M. J. 1994, ApJ, 421, 153 [NASA ADS] [CrossRef] [Google Scholar]
- Sikora, M., Stawarz, Ł., Moderski, R., Nalewajko, K., & Madejski, G. M. 2009, ApJ, 704, 38 [NASA ADS] [CrossRef] [Google Scholar]
- Sikora, M., Janiak, M., Nalewajko, K., Madejski, G. M., & Moderski, R. 2013, ApJ, 779, 68 [NASA ADS] [CrossRef] [Google Scholar]
- Vercellone, S., D’Ammando, F., Pucella, G., et al. 2009, ATel, 1976, 1 [NASA ADS] [Google Scholar]
- Villata, M., Raiteri, C. M., Larionov, V. M., et al. 2009, ATel, 1988, 1 [NASA ADS] [Google Scholar]
- Wagner, S. J., et al. (H.E.S.S. Collaboration) 2010, AAS/High Energy Astrophysics Division, 11, 2706 [NASA ADS] [Google Scholar]
- Wardle, J. F. C., Homan, D. C., Cheung, C. C., & Roberts, D. H. 2005, in Future Directions in High Resolution Astronomy, eds. J. Romney, & M. Reid, ASP Conf. Ser. 340, 67 [Google Scholar]
All Tables
All Figures
|
Fig. 1 Energy density of the extended fields as a function of the distance from the central source. The energy density is given in the jet comoving frame. The solid violet line represents the energy density of BLR, the dashed red line the energy density of DT, and the dash-dotted green line the energy density of magnetic field. |
| In the text | |
|
Fig. 2 Internal absorption as a function of photon energy emitted in the blazar zone. The values of attenuation presented for BLR, e− τ(E), are calculated for different distances from the center and assuming the PKS 1510-089 model parameters listed in Table 1. Left panel: R0 below RBLR. Right panel: R0 above RBLR. |
| In the text | |
|
Fig. 3 Klein-Nishina correction factor, σKN/σT, as a function of the photon energy for different electron Lorentz factors, γ (black lines). The blue and red lines represent the energy densities of two external photon fields, BLR and DT, respectively, transformed into the jet comoving frame. |
| In the text | |
|
Fig. 4 Rate of IC energy losses of relativistic electrons. The IC cooling is presented for two sources of seed photons: BLR (violet lines) and DT (red lines). The cooling rate was calculated for different electron Lorentz factors γ: 1, 100, 10 000. |
| In the text | |
|
Fig. 5 Overall spectrum of PKS 1510-089. The short-dashed blue line represents the synchrotron component, the dashed red line is the inverse Compton (IC) component with seed photons originating from the dusty torus (DT) before absorption, and the dashed-dotted violet line is the IC radiation with seed photons originating from the broadband region (BLR). The dash-double-dotted orange line is the SSC component. The solid black line represents the sum of all the components, corrected for EBL absorption (see text for details) and absorption on the low-energy photons originating from the BLR and the DT. |
| In the text | |
|
Fig. 6 H.E.S.S. observation of PKS 1510-089 and the model with and without absorption corrections. The shaded region shows the fit to the H.E.S.S. data at 68% confidence, and the points with error bars (1σ statistical errors) are the energy flux. Arrows denote the 99% confidence level. upper limits. Data taken from Abramowski et al. (2013b). The solid line represents the blazar model without internal and external absorption corrections. The long-dashed red line represents the blazar model after internal absorption correction. In the model proposed, where the blazar zone is located at a distance of ~1 pc, absorption in the BLR can be ignored. The absorption in the DT became significant at energies ~400 GeV, but the emissions, above these energies were not detected by H.E.S.S. in March 2009. The short-dashed blue line, the double-dot-dashed orange line, and the dash-dotted violet line represent the blazar model after internal absorption and external absorption using models provided by Franceschini et al. (2008), Gilmore et al. (2009), and Aharonian et al. (2006), respectively. |
| In the text | |
Current usage metrics show cumulative count of Article Views (full-text article views including HTML views, PDF and ePub downloads, according to the available data) and Abstracts Views on Vision4Press platform.
Data correspond to usage on the plateform after 2015. The current usage metrics is available 48-96 hours after online publication and is updated daily on week days.
Initial download of the metrics may take a while.