Fig. 6
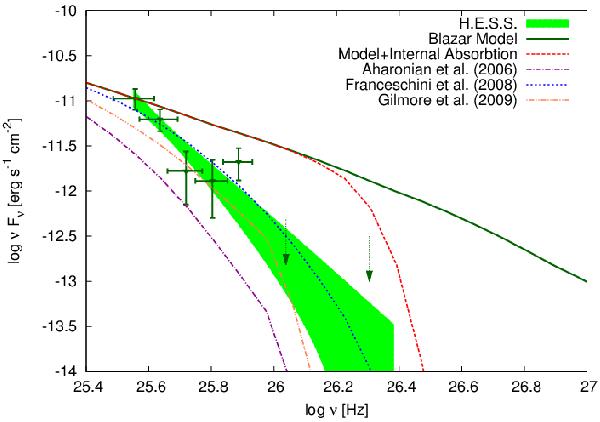
H.E.S.S. observation of PKS 1510-089 and the model with and without absorption corrections. The shaded region shows the fit to the H.E.S.S. data at 68% confidence, and the points with error bars (1σ statistical errors) are the energy flux. Arrows denote the 99% confidence level. upper limits. Data taken from Abramowski et al. (2013b). The solid line represents the blazar model without internal and external absorption corrections. The long-dashed red line represents the blazar model after internal absorption correction. In the model proposed, where the blazar zone is located at a distance of ~1 pc, absorption in the BLR can be ignored. The absorption in the DT became significant at energies ~400 GeV, but the emissions, above these energies were not detected by H.E.S.S. in March 2009. The short-dashed blue line, the double-dot-dashed orange line, and the dash-dotted violet line represent the blazar model after internal absorption and external absorption using models provided by Franceschini et al. (2008), Gilmore et al. (2009), and Aharonian et al. (2006), respectively.
Current usage metrics show cumulative count of Article Views (full-text article views including HTML views, PDF and ePub downloads, according to the available data) and Abstracts Views on Vision4Press platform.
Data correspond to usage on the plateform after 2015. The current usage metrics is available 48-96 hours after online publication and is updated daily on week days.
Initial download of the metrics may take a while.