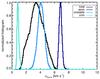
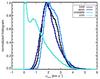
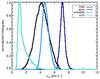
Fig. 8

Histograms of velocity dispersions: σtherm (top), σturb (middle) and σtot (bottom). On each panel, the different curves represent subsample of pixels selected according to their temperature: all pixels (black), the WNM (T> 5000 K, dark blue), the unstable gas (200 K<T< 5000 K, blue) and the CNM (T< 200 K, light blue). All quantities were computed using a high resolution simulation (10243 pixels) with the following initial conditions: n0 = 2.0 cm-3, ζ = 0.5 et vS = 7.5 km s-1.
Current usage metrics show cumulative count of Article Views (full-text article views including HTML views, PDF and ePub downloads, according to the available data) and Abstracts Views on Vision4Press platform.
Data correspond to usage on the plateform after 2015. The current usage metrics is available 48-96 hours after online publication and is updated daily on week days.
Initial download of the metrics may take a while.