Fig. 20
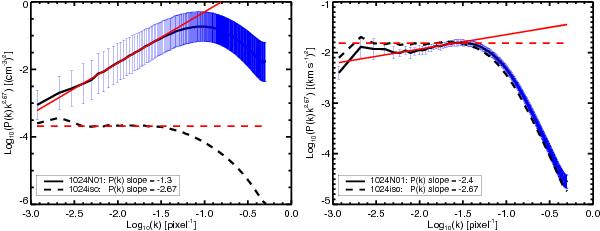
Compensated power spectra Pkk2.67 for n (left) and vz (right) computed on 1024N01 (black solid line) and on the isothermal simulation (black dashed line). The red lines indicate the power law fits done on the range of k given in Table 5. These power spectra are the average of all the Pk computed on each slices along the z-axis (see Fig. 19). The blue error bars indicate the dispersion at each k value.
Current usage metrics show cumulative count of Article Views (full-text article views including HTML views, PDF and ePub downloads, according to the available data) and Abstracts Views on Vision4Press platform.
Data correspond to usage on the plateform after 2015. The current usage metrics is available 48-96 hours after online publication and is updated daily on week days.
Initial download of the metrics may take a while.