Fig. 16
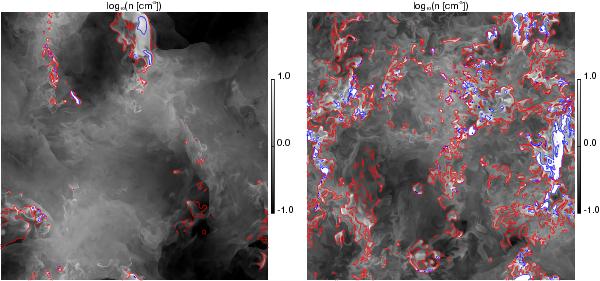
Maps of log 10(n) for 1024N01 (left) and 1024N02 (right). These maps are 2D slices in the 3D density cubes, taken at a time where the simulations have reached a stationary state. The contours are from the corresponding temperature cubes indicating frontiers at 200 K (blue lines) and 2000 K (red lines).
Current usage metrics show cumulative count of Article Views (full-text article views including HTML views, PDF and ePub downloads, according to the available data) and Abstracts Views on Vision4Press platform.
Data correspond to usage on the plateform after 2015. The current usage metrics is available 48-96 hours after online publication and is updated daily on week days.
Initial download of the metrics may take a while.