Fig. 9
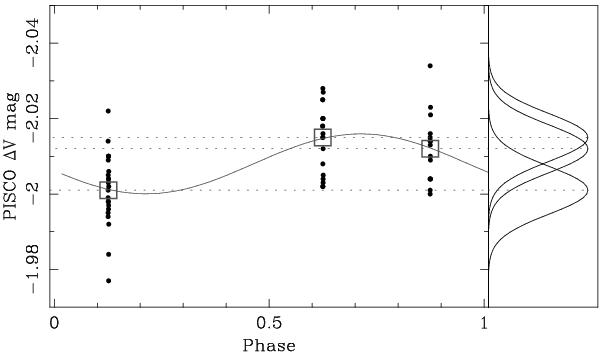
PISCO V-band photometry of AK For, when taken simultaneously with CORALIE observations in February 2013, which is phase-folded with the orbital period. For each night, squares mark the average values, their error is 2 mmag (size of symbols), and the dispersion is 9 mmag; corresponding Gaussians are shown to the right. The presence of spots can be deduced from a small but clear fading around phase 0.126, when the spot is presumably well visible. The brightness drop is 0.011 mag relative to the previous night (phase 0.875). The solid line is sine-fitted to data, plotted to guide the eye only, and has no physical meaning.
Current usage metrics show cumulative count of Article Views (full-text article views including HTML views, PDF and ePub downloads, according to the available data) and Abstracts Views on Vision4Press platform.
Data correspond to usage on the plateform after 2015. The current usage metrics is available 48-96 hours after online publication and is updated daily on week days.
Initial download of the metrics may take a while.