Free Access
Fig. 8
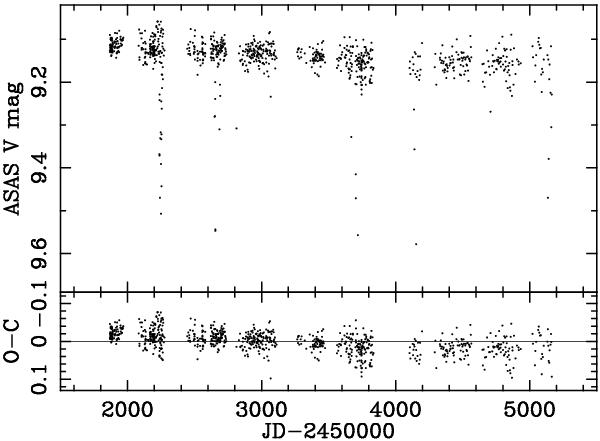
Long cadence ASAS light curve (top) and the residuals of the best-fitting model from the Fig. 5 (bottom) as a function of time. The change of the total brightness of the system is clearly visible, and can be explained by the evolution of the spot pattern.
Current usage metrics show cumulative count of Article Views (full-text article views including HTML views, PDF and ePub downloads, according to the available data) and Abstracts Views on Vision4Press platform.
Data correspond to usage on the plateform after 2015. The current usage metrics is available 48-96 hours after online publication and is updated daily on week days.
Initial download of the metrics may take a while.