Fig. 6
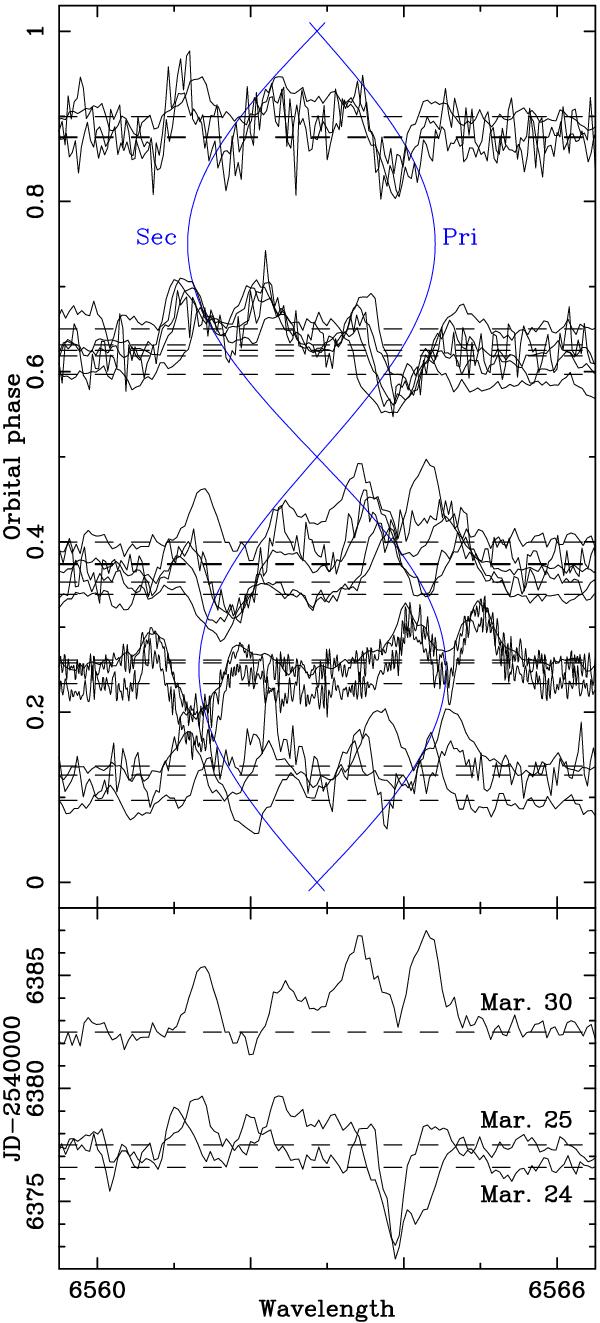
Hα emission lines of AK For. In a given panel, all spectra were continuum-fitted and equally scaled. The dashed lines show the level of continuum and mark the orbital phase or time of the observation. Top: all spectra are shown as a function of the orbital phase. Solid blue lines trace the position of the Hα line as predicted by the orbital solution. Bottom: three FEROS spectra from March 2013, which show rapid evolution of the Hα profiles. On March 30, the emission was much stronger than a few days earlier. Secondary’s emission is the stronger one.
Current usage metrics show cumulative count of Article Views (full-text article views including HTML views, PDF and ePub downloads, according to the available data) and Abstracts Views on Vision4Press platform.
Data correspond to usage on the plateform after 2015. The current usage metrics is available 48-96 hours after online publication and is updated daily on week days.
Initial download of the metrics may take a while.