Free Access
Fig. 4
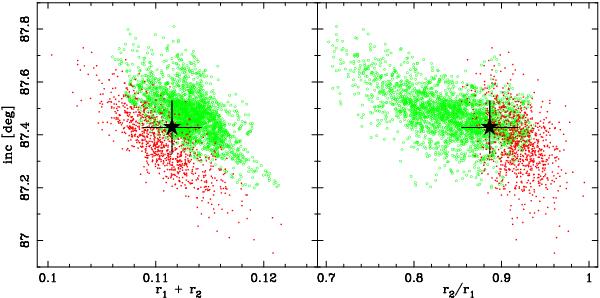
Results of the residual-shifts analysis performed with JKTEBOP on the ASAS (red) and SuperWASP data (green). Plots present the distribution of consecutive solutions on the r1 + r2 vs. i (left) and k = r2/r1 vs. i (right) panels. Black stars with error bars correspond to the adopted values with their 1σ uncertainties.
Current usage metrics show cumulative count of Article Views (full-text article views including HTML views, PDF and ePub downloads, according to the available data) and Abstracts Views on Vision4Press platform.
Data correspond to usage on the plateform after 2015. The current usage metrics is available 48-96 hours after online publication and is updated daily on week days.
Initial download of the metrics may take a while.