Fig. C.1
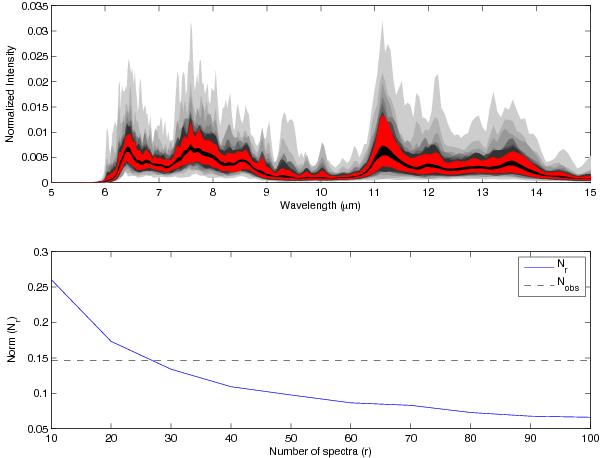
Top panel: range of variations in the kernel spectra as a function of the number of PAH species considered in the mixture: 10 species (light grey) through 90 species (dark grey). In red is the range for 100 species and in black the range for 548 species. Bottom panel: evolution of the norm Nr which captures the variations in the kernel spectra (blue line) and the norm Nobs which captures the variations in the observations (see text for details).
Current usage metrics show cumulative count of Article Views (full-text article views including HTML views, PDF and ePub downloads, according to the available data) and Abstracts Views on Vision4Press platform.
Data correspond to usage on the plateform after 2015. The current usage metrics is available 48-96 hours after online publication and is updated daily on week days.
Initial download of the metrics may take a while.