Fig. 3
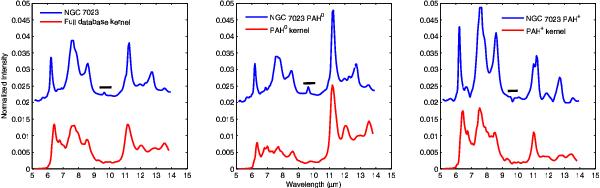
Comparison of the 5–15 μm kernel spectra (Fig. 2) with the observations and components from a blind signal decomposition (BSS) of the reflection nebula NGC 7023. Left panel: comparison of the spectrum of NGC 7023 (blue) and the kernel spectrum resulting from the 1000 random mixtures of 548 computed PAH spectra. Middle panel: comparison between the astronomical neutral PAHs (PAH0) spectrum extracted from the observations of NGC 7023 (blue) using blind signal separation techniques (Rapacioli et al. 2005; Berné et al. 2007; Berne et al. 2010; Appendix D) and the kernel spectrum (red) resulting from random mixtures of computed neutral PAH spectra. Right panel: same as the middle panel but now for cation PAH species (PAH+). In all panels, the solid black line indicates the pure rotational line of the molecular hydrogen molecule at 9.7 μm.
Current usage metrics show cumulative count of Article Views (full-text article views including HTML views, PDF and ePub downloads, according to the available data) and Abstracts Views on Vision4Press platform.
Data correspond to usage on the plateform after 2015. The current usage metrics is available 48-96 hours after online publication and is updated daily on week days.
Initial download of the metrics may take a while.