Fig. 2
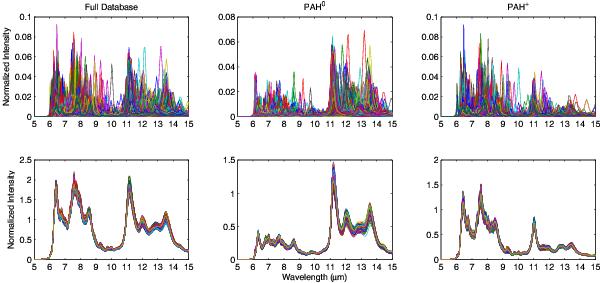
Effect of randomly mixing 5–15 μm PAH spectra. Left column: upper panel: calculated emission spectra for all of the 548 pure or nitrogenated PAH species from the NASA Ames PAH IR Spectroscopic Database (Bauschlicher et al. 2010; Boersma et al. 2014). Each color represents the spectrum of a different PAH species. The width of the PAH bands has been set to 15 cm-1 and a redshift of 15 cm-1 has been applied to mimic some effects of anharmonicity. These parameters have been selected to convert the database spectra from absorption into emission spectra and are close to values observed in the laboratory (Appendix A). Lower panel: 1000 random mixtures of the 548 different PAH emission spectra in the upper panel. Each color represents one of the 1000 mixtures, each mixture containing 548 species in different abundances. Middle column: same as left column but considering only PAH cations (PAH+). Right column: same as left column but considering only PAH neutrals (PAH0).
Current usage metrics show cumulative count of Article Views (full-text article views including HTML views, PDF and ePub downloads, according to the available data) and Abstracts Views on Vision4Press platform.
Data correspond to usage on the plateform after 2015. The current usage metrics is available 48-96 hours after online publication and is updated daily on week days.
Initial download of the metrics may take a while.