Fig. 1
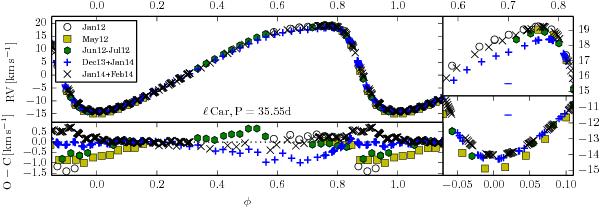
New Coralie RV data for ℓ Car (N = 324). The large panel shows the phased RV curve, distinguishing data from different epochs by symbol style and color. The two right-hand panels provide close-ups around maximum (upper) and minimum RV (lower), and show the median RV uncertainty as an errorbar (too small to discern in this case). The bottom panel shows residuals around an “average” Fourier series model fit to the combined data set (fit procedure described in Anderson et al. 2013). Figures for the other Cepheids are provided in Appendix A.
Current usage metrics show cumulative count of Article Views (full-text article views including HTML views, PDF and ePub downloads, according to the available data) and Abstracts Views on Vision4Press platform.
Data correspond to usage on the plateform after 2015. The current usage metrics is available 48-96 hours after online publication and is updated daily on week days.
Initial download of the metrics may take a while.