This article has 2 errata:
[https://doi.org/10.1051/0004-6361/201527565]
[https://doi.org/10.1051/0004-6361/201423481e]
Fig. 9
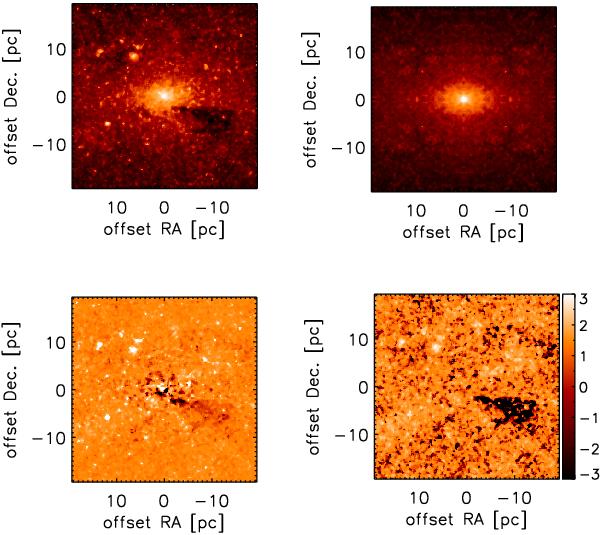
Top left: zoom onto PAH- and extinction-corrected image of the MWNSC at 4.5 μm. Top right: symmetrised image resulting from folding and median-averaging the four quadrants. Both images in the top have been median-smoothed with a 3-pixel wide box to enhance the large-scale structures. Bottom left: difference between top left and right panels. Bottom right: difference image divided by the uncertainty map resulting from quadratically combining the pixel uncertainties of the images in the top left and right panels. Galactic north is up and Galactic east is to the left. The colour bar in the bottom right panel is in units of standard deviation.
Current usage metrics show cumulative count of Article Views (full-text article views including HTML views, PDF and ePub downloads, according to the available data) and Abstracts Views on Vision4Press platform.
Data correspond to usage on the plateform after 2015. The current usage metrics is available 48-96 hours after online publication and is updated daily on week days.
Initial download of the metrics may take a while.