Free Access
This article has 2 errata:
[https://doi.org/10.1051/0004-6361/201527565]
[https://doi.org/10.1051/0004-6361/201423481e]
Fig. 6
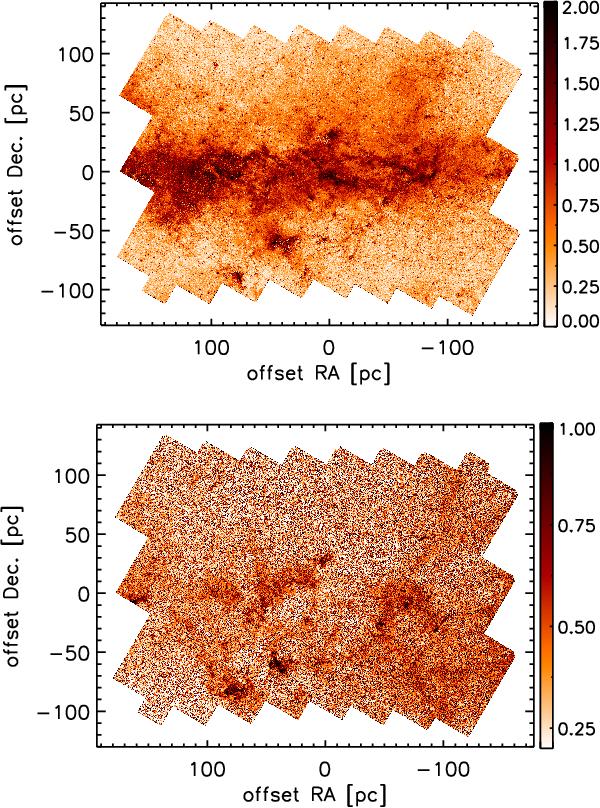
Upper panel: 4.5 μm extinction map. Lower panel: corresponding uncertainty map, including statistical and systematic uncertainties. The unit of the colour bar is in magnitudes. These maps are made available in electronic form at the CDS.
Current usage metrics show cumulative count of Article Views (full-text article views including HTML views, PDF and ePub downloads, according to the available data) and Abstracts Views on Vision4Press platform.
Data correspond to usage on the plateform after 2015. The current usage metrics is available 48-96 hours after online publication and is updated daily on week days.
Initial download of the metrics may take a while.