This article has 2 errata:
[https://doi.org/10.1051/0004-6361/201527565]
[https://doi.org/10.1051/0004-6361/201423481e]
Fig. 3
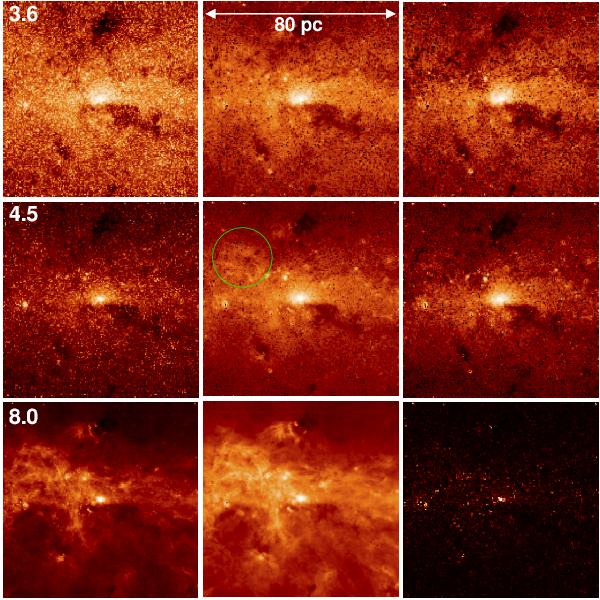
Left column: 3.6, 4.5, and 8.0 μm images of the central 80 × 80 pc2 of the GC. The middle column shows the diffuse background resulting after point-source subtraction from each image. The right column shows, from top to bottom, the diffuse 3.6 μm emission (top middle) minus 0.03 times the 8.0 μm image (bottom left), the diffuse 4.5 μm emission (centre) minus 0.04 times the 8.0 μm image (bottom left), the 8.0 μm image (bottom left) minus diffuse emission at 8.0 μm (bottom middle). The green circle in the middle panel indicates a region with strong PAH emission in the 4.5 μm image.
Current usage metrics show cumulative count of Article Views (full-text article views including HTML views, PDF and ePub downloads, according to the available data) and Abstracts Views on Vision4Press platform.
Data correspond to usage on the plateform after 2015. The current usage metrics is available 48-96 hours after online publication and is updated daily on week days.
Initial download of the metrics may take a while.