Free Access
This article has 2 errata:
[https://doi.org/10.1051/0004-6361/201527565]
[https://doi.org/10.1051/0004-6361/201423481e]
Fig. 12
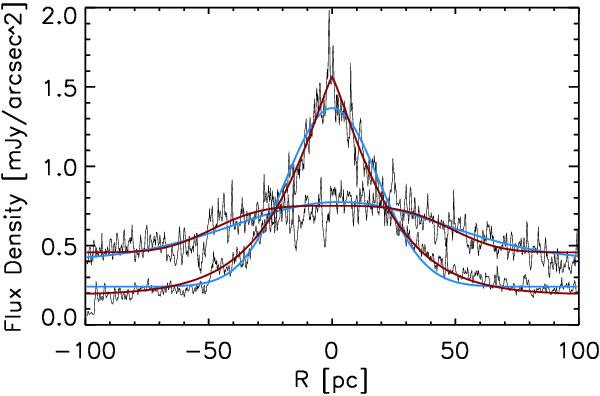
Mean flux density profiles (black) horizontally (broad profile) and vertically (narrow profile) through the NSD at positions ~20 pc to the north/south and east/west of Sgr A*. The blue lines are best-fit Gaussians and the red lines are best-fit Sérsic profiles.
Current usage metrics show cumulative count of Article Views (full-text article views including HTML views, PDF and ePub downloads, according to the available data) and Abstracts Views on Vision4Press platform.
Data correspond to usage on the plateform after 2015. The current usage metrics is available 48-96 hours after online publication and is updated daily on week days.
Initial download of the metrics may take a while.