Free Access
This article has 2 errata:
[https://doi.org/10.1051/0004-6361/201527565]
[https://doi.org/10.1051/0004-6361/201423481e]
Fig. 11
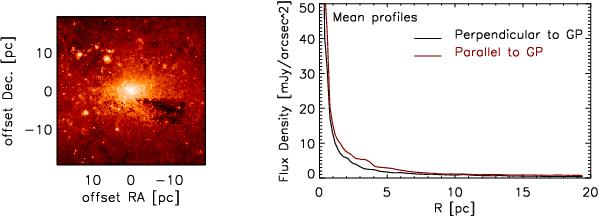
Left: image of the diffuse 4.5 μm emission of the NSC, after subtraction of the point sources detected by StarFinder. The image was corrected for PAH emission and extinction. Right: profile of the mean diffuse emission parallel and perpendicular to the Galactic plane.
Current usage metrics show cumulative count of Article Views (full-text article views including HTML views, PDF and ePub downloads, according to the available data) and Abstracts Views on Vision4Press platform.
Data correspond to usage on the plateform after 2015. The current usage metrics is available 48-96 hours after online publication and is updated daily on week days.
Initial download of the metrics may take a while.