Fig. 6
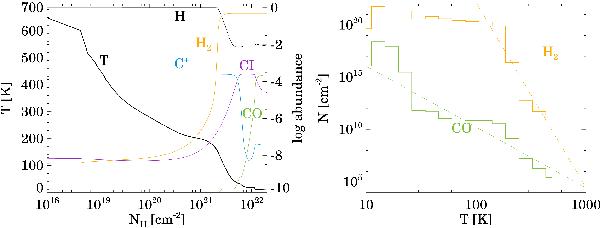
Left panel: chemical structure and temperature of a PDR with G0 = 104 and nH = 104 cm-3. The thick black line is the gas temperature (left axis). The other lines represent the abundances (left axis) of H (black), H2 (orange), C+ (blue), C i (violet), and CO (green). Right panel: H2 (orange) and CO (green) column densities as a function of the temperature. The dashed lines are the best power-law fits to the distribution (see Sect. 6.1).
Current usage metrics show cumulative count of Article Views (full-text article views including HTML views, PDF and ePub downloads, according to the available data) and Abstracts Views on Vision4Press platform.
Data correspond to usage on the plateform after 2015. The current usage metrics is available 48-96 hours after online publication and is updated daily on week days.
Initial download of the metrics may take a while.