Fig. 2
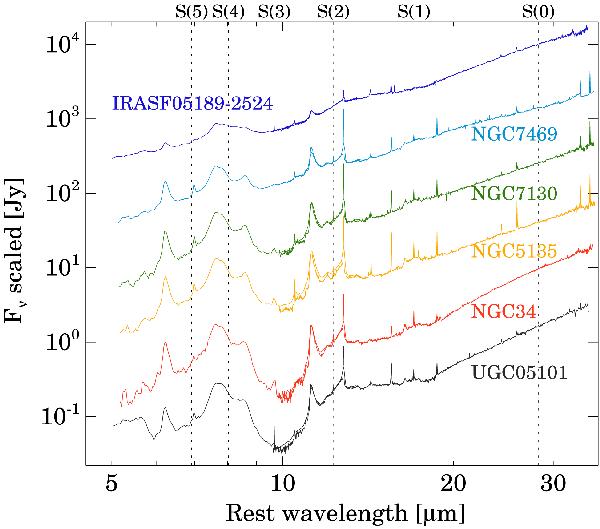
Rest-frame Spitzer/IRS spectra. The short-low (5.5–14 μm), short-high (10–19 μm), and long-high (19–36 μm) spectra are plotted for each galaxy. For clarity, the spectra are multiplied by the following factors 1, 2.5, 14, 100, 220, and 2000, from bottom to top. The wavelengths of the H2 rotational transitions are indicated.
Current usage metrics show cumulative count of Article Views (full-text article views including HTML views, PDF and ePub downloads, according to the available data) and Abstracts Views on Vision4Press platform.
Data correspond to usage on the plateform after 2015. The current usage metrics is available 48-96 hours after online publication and is updated daily on week days.
Initial download of the metrics may take a while.