Fig. 3
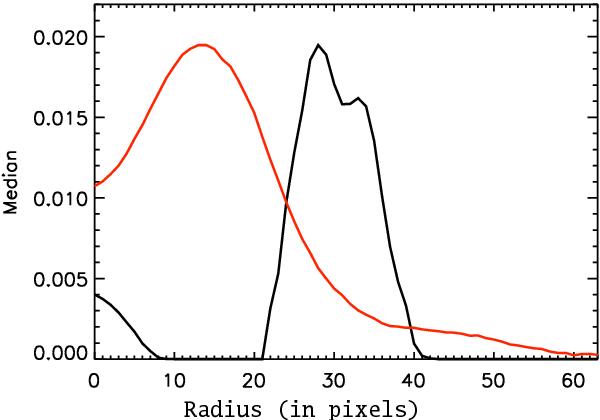
Median pixel values along the pixel rows of the curvelet-filtered images shown in the third column of Fig. 2. The black line corresponds to the top row of Fig. 2, and the red line corresponds to the bottom row. A simple thresholding scheme allows us to detect the spike and to measure directly the size of the Einstein ring (see text).
Current usage metrics show cumulative count of Article Views (full-text article views including HTML views, PDF and ePub downloads, according to the available data) and Abstracts Views on Vision4Press platform.
Data correspond to usage on the plateform after 2015. The current usage metrics is available 48-96 hours after online publication and is updated daily on week days.
Initial download of the metrics may take a while.