Fig. 9
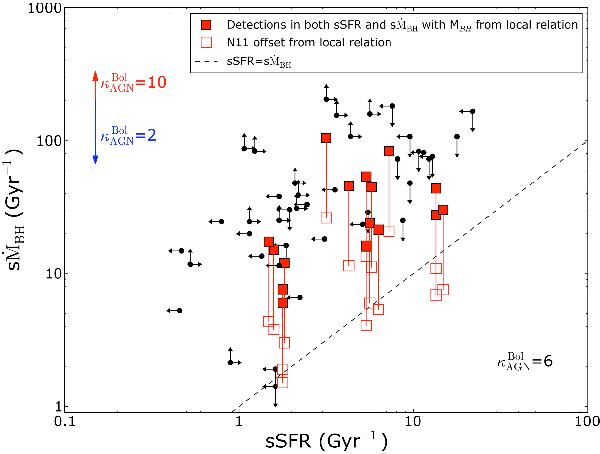
The specific star formation rate (sSFR, in Gyr-1) versus the specific black hole accretion rate, sṀBH (in Gyr-1). The galaxies with constrained estimates of both sSFR and sṀBH are shown in red, while the arrows indicated upper or lower limits for each or both quantities. sṀBH was estimated using the local MBH–MBulge relation (filled red diamonds) or using the N11 offset (empty red squares, see Sect. 6.2.3). The dashed line indicates where the sṀBH = sSFR.
Current usage metrics show cumulative count of Article Views (full-text article views including HTML views, PDF and ePub downloads, according to the available data) and Abstracts Views on Vision4Press platform.
Data correspond to usage on the plateform after 2015. The current usage metrics is available 48-96 hours after online publication and is updated daily on week days.
Initial download of the metrics may take a while.