Fig. 7
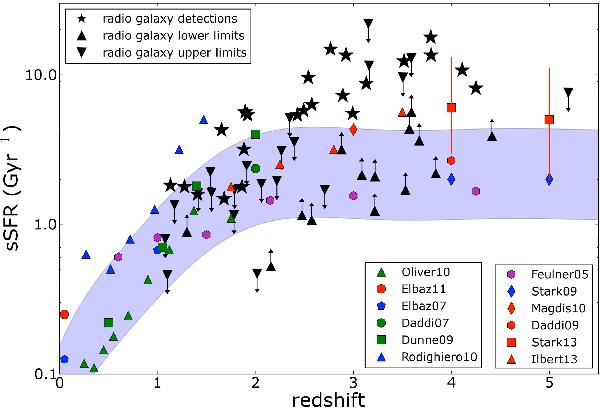
The specific star formation rate (sSFR, in Gyr-1) as a function of redshift. The various coloured points represent measurements from the literature at M⋆ ~ 1010M⊙; see the references in the legend at the bottom right. Since the slope of the sSFR-M⋆ relation is approximately zero, the rate at which the sSFR evolves is largely independent of M⋆. Thus, this is an appropriate comparison, even for galaxies as massive as the radio galaxies studied here. The black stars, triangles, and upside-down triangles represent the radio galaxy detections, lower limits, and upper limits to the sSFR, respectively. The blue shaded region represents the scatter in the observed sSFR values (±0.3 dex). This rendition of the evolution of the sSFR was inspired by a similar plot in Weinmann et al. (2011). See also Lenhert et al. (in prep.).
Current usage metrics show cumulative count of Article Views (full-text article views including HTML views, PDF and ePub downloads, according to the available data) and Abstracts Views on Vision4Press platform.
Data correspond to usage on the plateform after 2015. The current usage metrics is available 48-96 hours after online publication and is updated daily on week days.
Initial download of the metrics may take a while.