Fig. 6
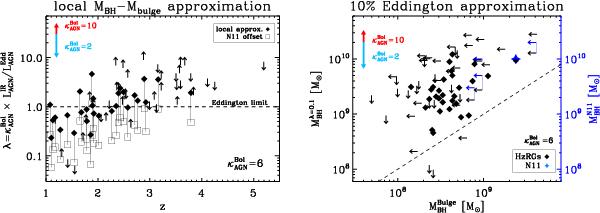
Illustration of the two different, mutually exclusive assumptions (Sect. 6.2.3). In both figures we assume  . We also plot the influence of
  with a vector of the most likely values (see Appendix C). Left: Eddington ratio λ (Eq. (4)) versus redshift. We draw the Eddington limit at λ = 1.0 (dashed line). We assume . Black diamonds are the calculated Eddington ratios assuming the MBH–MGal relation while the open squares linked by a thin line represent the same black hole assuming the offset from the local relation from (Nesvadba et al. 2011, see text for details). Right: MBH from the two different hypotheses, assuming the local MBH–MGal (bottom axis) and assuming λ = 0.1 (left axis). The dashed line represent the one-to-one relation. The blue points (arrows and star) are the black hole masses measured from Hα lines (Nesvadba et al. 2011) and compared to the black hole masses from the stellar masses from (De Breuck et al. 2010). These points therefore do not assume λ = 0.1.
Current usage metrics show cumulative count of Article Views (full-text article views including HTML views, PDF and ePub downloads, according to the available data) and Abstracts Views on Vision4Press platform.
Data correspond to usage on the plateform after 2015. The current usage metrics is available 48-96 hours after online publication and is updated daily on week days.
Initial download of the metrics may take a while.