Fig. 3
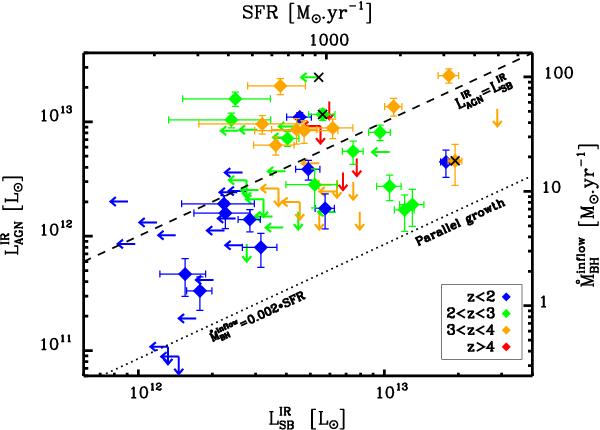
 versus
  . The top axis converts to SFR using the Kennicutt (1998) relation (Eq. (1)). The right axis converts to ṀBH assuming ϵ = 0.1 and
  (Eq. (2)). The dashed line marks = . This dashed line indicates the relation corresponding to ṀBH = 0.024 ×SFR, using the right and top axes. The dotted line represents the parallel growth mode, where black holes and galaxies grow simultaneously, following the MBH–MGal relation (see Sect. 6.1.3 for details). Colours indicate redshift bins. The three crosses indicate the three sources of peculiar interest, 4C 23.56, PKS 1138-262 and 4C 41.17.
Current usage metrics show cumulative count of Article Views (full-text article views including HTML views, PDF and ePub downloads, according to the available data) and Abstracts Views on Vision4Press platform.
Data correspond to usage on the plateform after 2015. The current usage metrics is available 48-96 hours after online publication and is updated daily on week days.
Initial download of the metrics may take a while.