Fig. 2
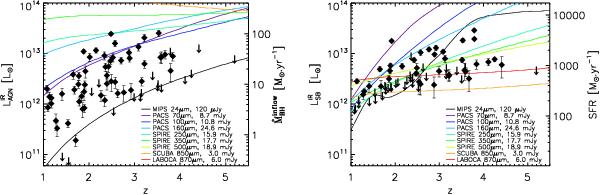
Left:  against redshift. The ordinate on the right-hand side of the plot is calculated using Eq. (2) assuming a radiative conversion efficiency ϵ = 0.1 and
  (Sect. 6.1.2). Right:
  against redshift. The ordinate on the right-hand side of the plot is calculated using Eq. (1), assuming the Kennicutt (1998) law. We indicate our average 3σ-sensitivity limit for the AGN and the SB3 templates for each filter (see Sect. 5.1 for details, figure inspired by Elbaz et al. 2011). It can be seen that in a case of pure AGN emission, MIPS (24 μm) is the most sensitive band over the entire redshift range, while in the case of a pure starburst emission, the most sensitive band at z> 2 is in the submm (APEX or SCUBA).
Current usage metrics show cumulative count of Article Views (full-text article views including HTML views, PDF and ePub downloads, according to the available data) and Abstracts Views on Vision4Press platform.
Data correspond to usage on the plateform after 2015. The current usage metrics is available 48-96 hours after online publication and is updated daily on week days.
Initial download of the metrics may take a while.