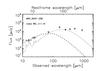
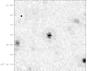
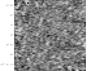
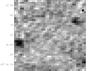
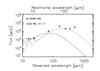
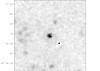
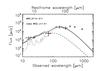
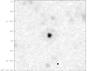
Fig. D.1
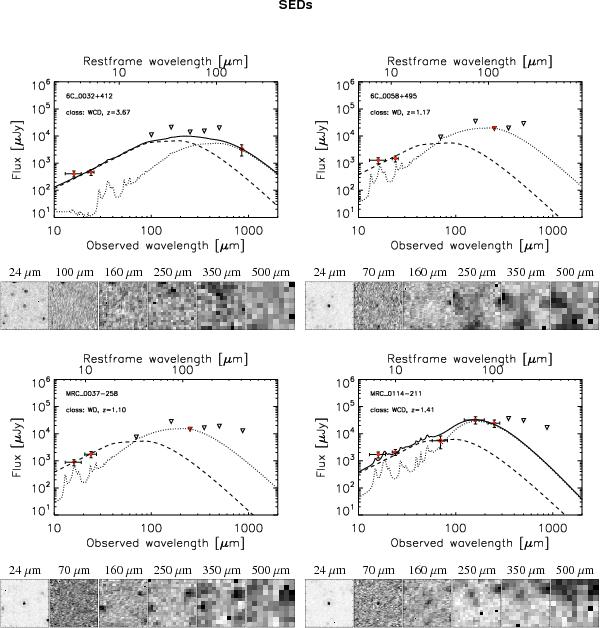
SEDs of the 70 radiogalaxies sorted by RA. IRS and MIPS data taken from De Breuck et al. (2010), PACS and SPIRE data in Table 3, and submm data in Table 4. Filled diamonds are the firm detections (>3σ), open diamonds the weak detections (2σ<Fgal< 3σ), and downward triangles the 3σ upper limits. The red downward triangles mark to the most constraining upper limit. Continuous line represents for fitted components, depending on the class: AGN for WD, SB for CD, and sum of AGN and SB for WCD (as marked in the figure legend). The six stamps correspond to the MIPS (24 μm) and the five Herschel observations when available, with north at the top, east at the left, centred on the radio coordinates of the radio galaxy. Each stamp covers 2 × 2 arcmin. We also overplot the IRS spectra when available for the source (Seymour et al. 2008; Rawlings et al. 2013).
Current usage metrics show cumulative count of Article Views (full-text article views including HTML views, PDF and ePub downloads, according to the available data) and Abstracts Views on Vision4Press platform.
Data correspond to usage on the plateform after 2015. The current usage metrics is available 48-96 hours after online publication and is updated daily on week days.
Initial download of the metrics may take a while.