Free Access
Fig. 1
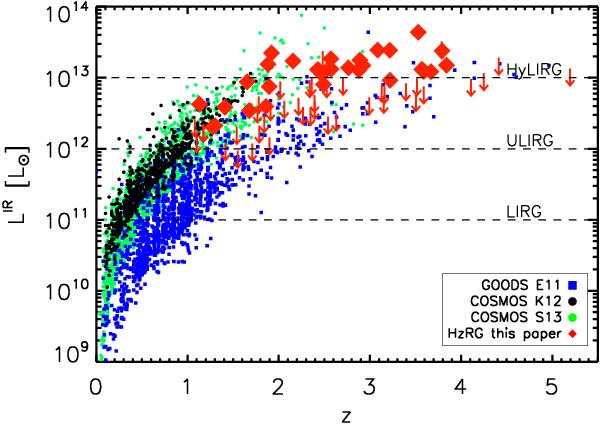
Total IR luminosity ( ) versus redshift. The green dots are the COSMOS sample from Kartaltepe et al. (2010), using Spitzer data. The blue squares are the GOODS samples from Elbaz et al. (2011). The black dots are the selection from Symeonidis et al. (2013). We also indicate the LIRG, ULIRG and HyLIRG limits.
Current usage metrics show cumulative count of Article Views (full-text article views including HTML views, PDF and ePub downloads, according to the available data) and Abstracts Views on Vision4Press platform.
Data correspond to usage on the plateform after 2015. The current usage metrics is available 48-96 hours after online publication and is updated daily on week days.
Initial download of the metrics may take a while.