Fig. 8
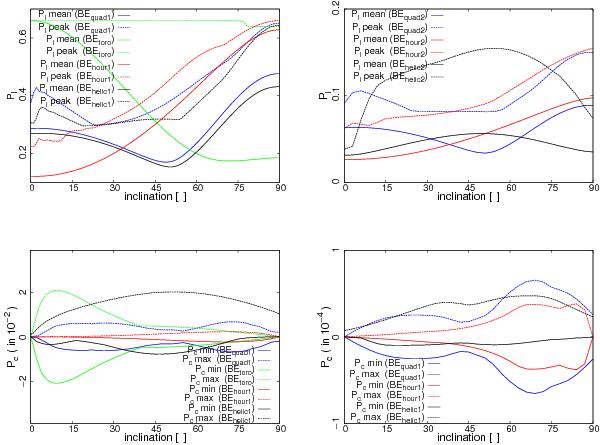
Resulting degrees of linear polarization Pl (top) and circular polarization Pc (bottom) for perfectly (left) and imperfectly (right) aligned dust grains depending on inclination angle at a wavelength of 811 μm for the ideal Bonnor−Ebert sphere setups as presented in Sect. 3.1. For the degree of linear polarization Pl the mean values are plotted as solid lines and the peak values are in dashed lines. For circular polarization Pc the lowest values are plotted as solid lines, the highest values as dashed lines. The details of all model setups are listed in Table 1.
Current usage metrics show cumulative count of Article Views (full-text article views including HTML views, PDF and ePub downloads, according to the available data) and Abstracts Views on Vision4Press platform.
Data correspond to usage on the plateform after 2015. The current usage metrics is available 48-96 hours after online publication and is updated daily on week days.
Initial download of the metrics may take a while.