Fig. 10
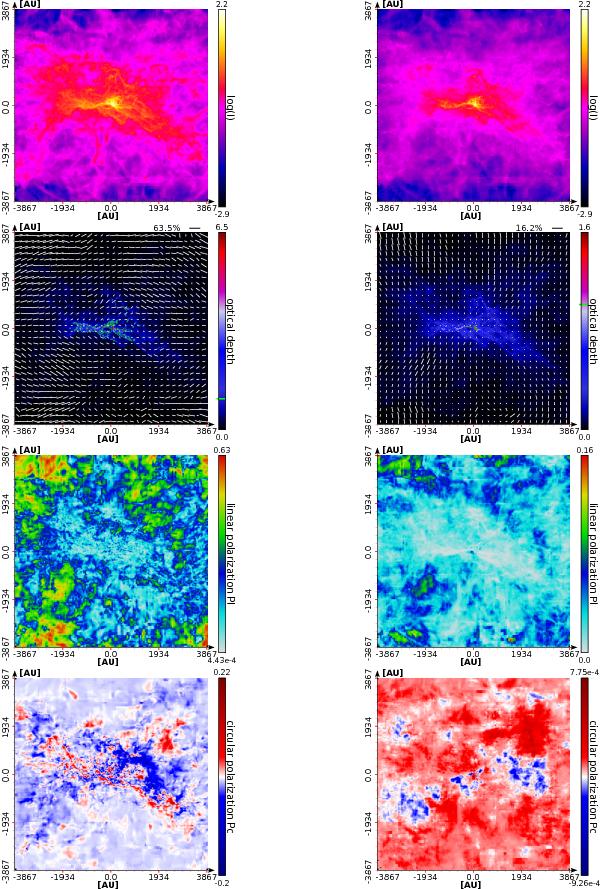
Resulting intensity maps (top row), optical depth maps (second top row), maps of linear (third top row) and circular (bottom row) polarization of setup MHDsim1 (left column) and MHDsim2 (right column) at a wavelength of λ = 248 μm. The intensity is in Wm-2 m-1 and the vectors of linear polarization have an offset angle of 90°. The color bar of the intensity map is on a logarithmic scale, and for the optical depth we apply an upper cut-off at 15% for illustrative purposes. The transition between optically thin and optically thick regions is indicated by the green contour lines and a marker in the color bar.
Current usage metrics show cumulative count of Article Views (full-text article views including HTML views, PDF and ePub downloads, according to the available data) and Abstracts Views on Vision4Press platform.
Data correspond to usage on the plateform after 2015. The current usage metrics is available 48-96 hours after online publication and is updated daily on week days.
Initial download of the metrics may take a while.