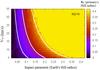
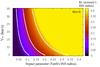
Fig. 4

Stable radial limit of the satellites of NEAs as a function of the impact parameter (d) and of the relative velocity (V∞), for the particles case (M2 = 0). a) Resulting from the numerical simulation. b) Generated through the fit (Eq. (3)). The color-coded scales correspond to the critical initial orbital radius RC, given in the primary’s Hill radius. The white lines delimit three basic regimes: weak, moderate, and extreme disruption limits from right to left, respectively.
Current usage metrics show cumulative count of Article Views (full-text article views including HTML views, PDF and ePub downloads, according to the available data) and Abstracts Views on Vision4Press platform.
Data correspond to usage on the plateform after 2015. The current usage metrics is available 48-96 hours after online publication and is updated daily on week days.
Initial download of the metrics may take a while.