Fig. 5
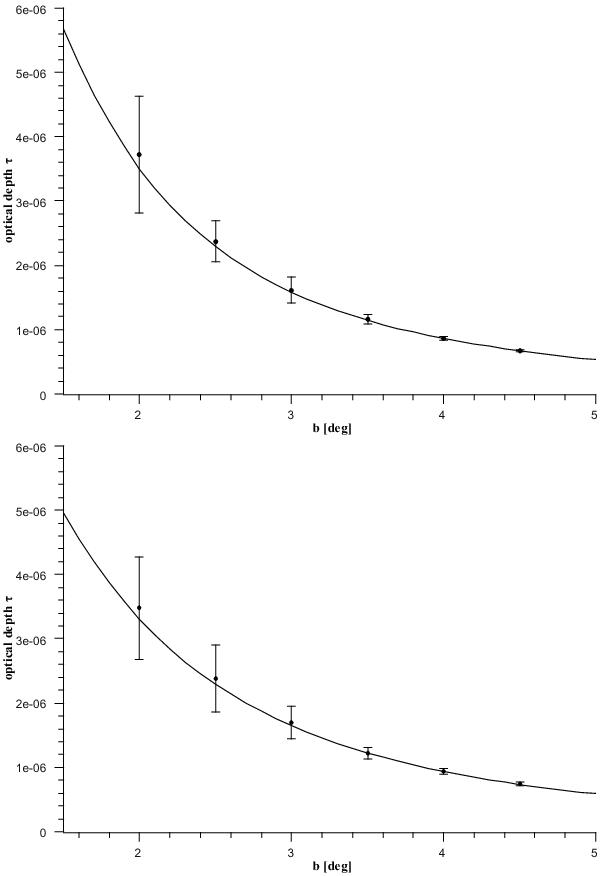
Results of a Monte Carlo simulation: the mean optical depth and its standard deviation for a sample of sources chosen randomly with a probability distribution proportional to ρ(r,z), (points+error bars). For comparison, the (solid line) shows the optical depth calculated with the help of the integral of Eq. (7) with l = 0 and χ = 0. Top panel: results for the Mexican hat vertical profile with h = 117 pc. Bottom panel: results for the exponential vertical profile with h′ = 88 pc.
Current usage metrics show cumulative count of Article Views (full-text article views including HTML views, PDF and ePub downloads, according to the available data) and Abstracts Views on Vision4Press platform.
Data correspond to usage on the plateform after 2015. The current usage metrics is available 48-96 hours after online publication and is updated daily on week days.
Initial download of the metrics may take a while.