Fig. 9
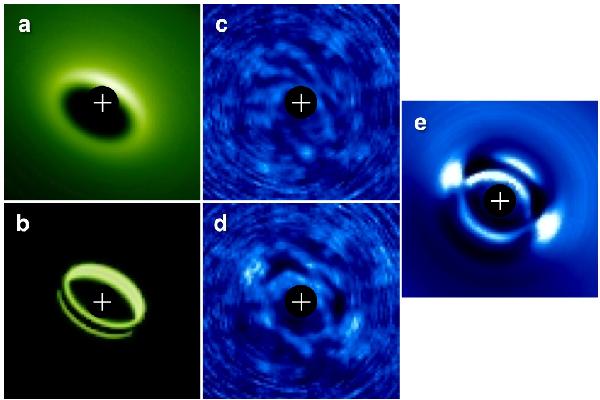
Comparison of the best-fit solutions for the near-side (g = 0.7, o = 150°) and the far-side (g = 0, o = 230°) scenarios for the K3 dataset. a) Image of the unconvolved best-fit model near-side disk model at logarithmic stretch. b) Same for the best-fit far-side model. Note that the dark lane on the faint side is not generated by the shadow cast from the inner disk in this configuration, but rather by the optically thick bulk of the outer disk blocking the view onto the illuminated face of the gap wall. The two parallel arcs of light are scattered light spilling around the edges of the near-side wall. c) S/N map of the residual image after subtracting the ADI-processed near-side model image from the ADI-processed data at a linear stretch of ± 5σ. d) Same for the far-side model. e) Difference of the images d)–c), at a linear stretch of ± 2σ. The χ2 of the far-side model exceeds that of the near-side model by 18 Δχ2. We therefore conclude that the bright crescent in the data represents the strongly forward-scattering near side of the disk.
Current usage metrics show cumulative count of Article Views (full-text article views including HTML views, PDF and ePub downloads, according to the available data) and Abstracts Views on Vision4Press platform.
Data correspond to usage on the plateform after 2015. The current usage metrics is available 48-96 hours after online publication and is updated daily on week days.
Initial download of the metrics may take a while.