Fig. 5
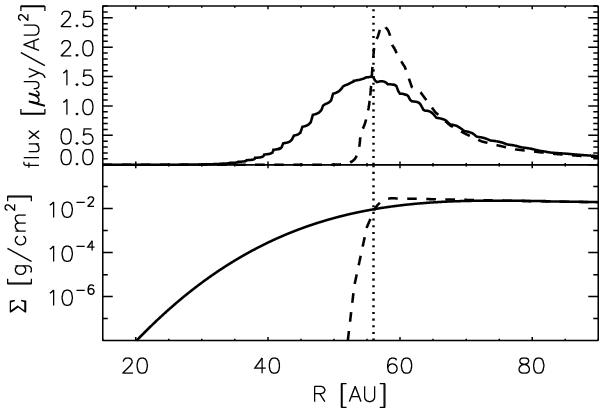
Azimuthally averaged surface brightness profile (top) and corresponding surface density profile (bottom), demonstrating the effect of rounding off the disk wall (w> 0). The solid line shows the best-fit model with a wall shape of w = 0.30, as compared to a more vertical wall with w = 0.05 (dashed line). The dotted line indicates the “wall location” r, corresponding to the radial peak in intensity.
Current usage metrics show cumulative count of Article Views (full-text article views including HTML views, PDF and ePub downloads, according to the available data) and Abstracts Views on Vision4Press platform.
Data correspond to usage on the plateform after 2015. The current usage metrics is available 48-96 hours after online publication and is updated daily on week days.
Initial download of the metrics may take a while.