Fig. 3
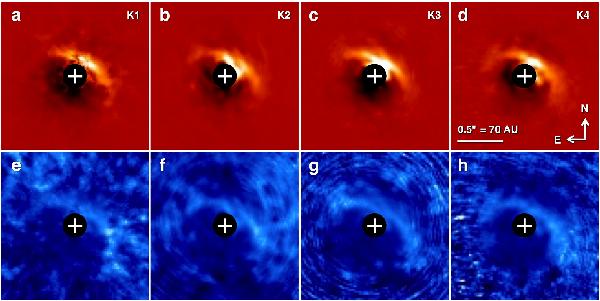
Comparison of the four Gemini NIRI Ks-band observing runs of LkCa 15. All datasets were reduced with classical ADI. As in Fig. 2, the upper row shows the resulting images at a linear stretch of ± 1.6 × 10⁻³ times the stellar peak flux, whereas the bottom row shows radially renormalized versions of the same images at a stretch of ± 4σ. a) K1, b) K2, c) K3, d) K4. Since the target star is saturated in runs K1 and K2, their flux normalization is approximate.
Current usage metrics show cumulative count of Article Views (full-text article views including HTML views, PDF and ePub downloads, according to the available data) and Abstracts Views on Vision4Press platform.
Data correspond to usage on the plateform after 2015. The current usage metrics is available 48-96 hours after online publication and is updated daily on week days.
Initial download of the metrics may take a while.