Fig. B.4
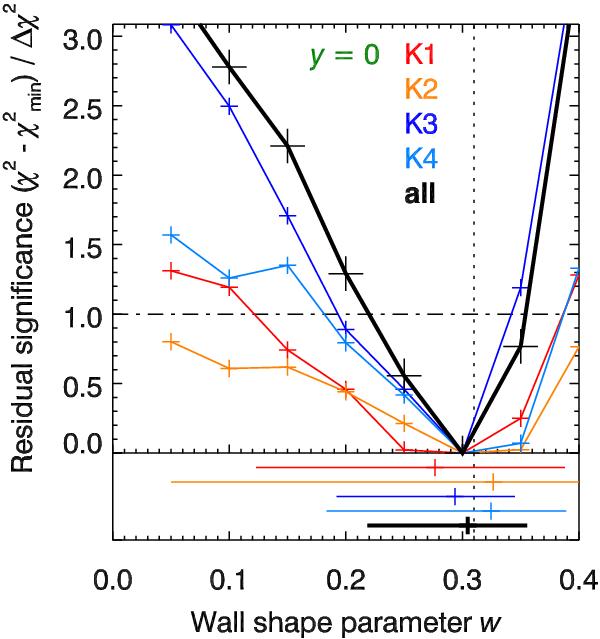
Constraints on wall shape parameter w under the restriction of y = 0. The plot shows the excess of the best-fit χ2 for a given w with respect to the global minimum  , which is normalized by the threshold value Δχ2. The color-coded curves represent each individual epoch, whereas the thick black curve is obtained by combining all four epochs. The vertical dotted line marks the best-fit value of w from the unrestricted analysis, which coincides with the values obtained under y = 0. The bottom panel shows the well fitting range and the best-fit value for all five analyses.
Current usage metrics show cumulative count of Article Views (full-text article views including HTML views, PDF and ePub downloads, according to the available data) and Abstracts Views on Vision4Press platform.
Data correspond to usage on the plateform after 2015. The current usage metrics is available 48-96 hours after online publication and is updated daily on week days.
Initial download of the metrics may take a while.