Free Access
Fig. 20
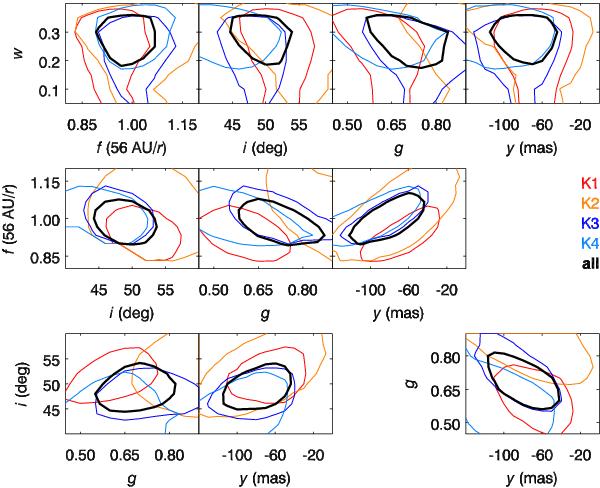
Visualization of the covariances between the model parameters r, i, g, w, y. The contours delineate the well fitting solution family ( ) for each epoch and for the combination of all four epochs. The strongest covariances are seen between (f,y) and (y,g).
Current usage metrics show cumulative count of Article Views (full-text article views including HTML views, PDF and ePub downloads, according to the available data) and Abstracts Views on Vision4Press platform.
Data correspond to usage on the plateform after 2015. The current usage metrics is available 48-96 hours after online publication and is updated daily on week days.
Initial download of the metrics may take a while.