Fig. 14
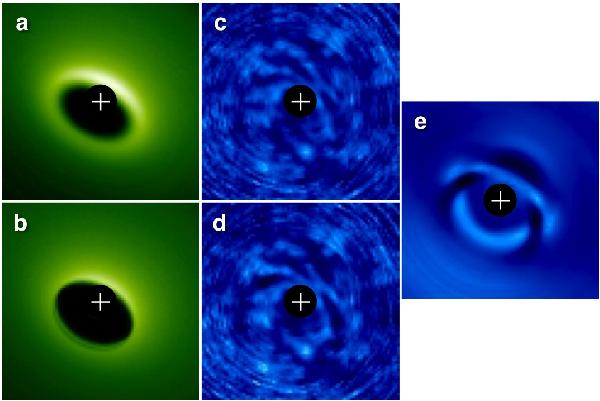
Comparison of the best-fit solutions for s = 0 and s = 1 for the K3 dataset. a) Image of the unconvolved best-fit model disk with s = 0 at logarithmic stretch. b) Same for s = 1. Note the lane of shadowing from the inner disk visible on the far-side gap wall. c) S/N map of the residual image after subtracting the ADI-processed best-fit model image with s = 0 from the ADI-processed data at a linear stretch of ± 5σ. d) Same for s = 1. e) Difference of the images d)–c) at a linear stretch of ± 2σ. The χ2 of the s = 1 model exceeds that of the s = 0 model by 7.4 Δχ2.
Current usage metrics show cumulative count of Article Views (full-text article views including HTML views, PDF and ePub downloads, according to the available data) and Abstracts Views on Vision4Press platform.
Data correspond to usage on the plateform after 2015. The current usage metrics is available 48-96 hours after online publication and is updated daily on week days.
Initial download of the metrics may take a while.