Fig. 10
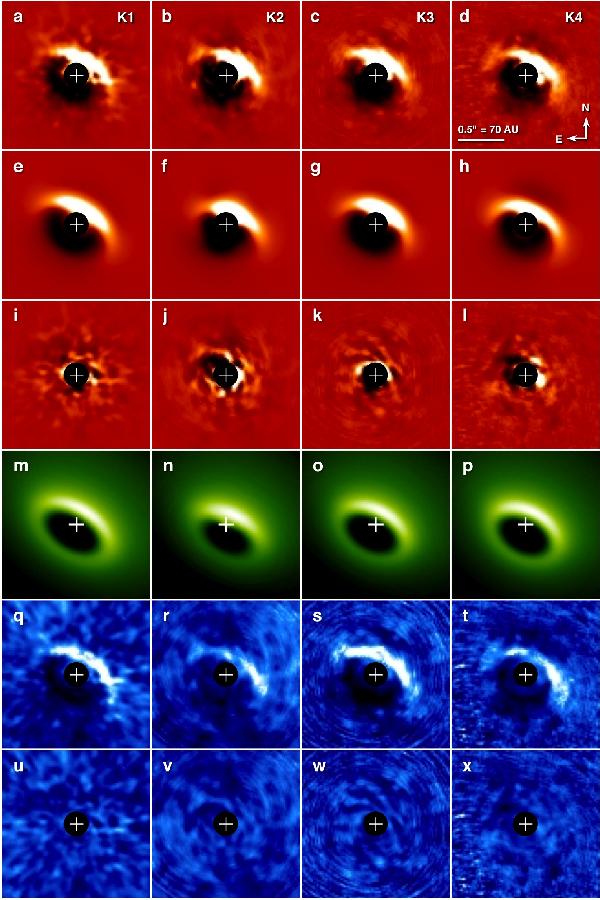
Best-fit models for the LkCa 15 disk. The columns represent the four epochs of observation, K1–K4. a)–d) ADI output images from science data; e)–h) ADI output images from the simulated model disks; i)–l) science–model subtraction residuals at the same linear stretch; m)–p) unprocessed model disk images at logarithmic stretch; q)–t) S/N maps of the science ADI output images at a linear stretch of [− 5σ,5σ]; u)–x) S/N maps of the subtraction residuals at the same stretch.
Current usage metrics show cumulative count of Article Views (full-text article views including HTML views, PDF and ePub downloads, according to the available data) and Abstracts Views on Vision4Press platform.
Data correspond to usage on the plateform after 2015. The current usage metrics is available 48-96 hours after online publication and is updated daily on week days.
Initial download of the metrics may take a while.