Fig. 4
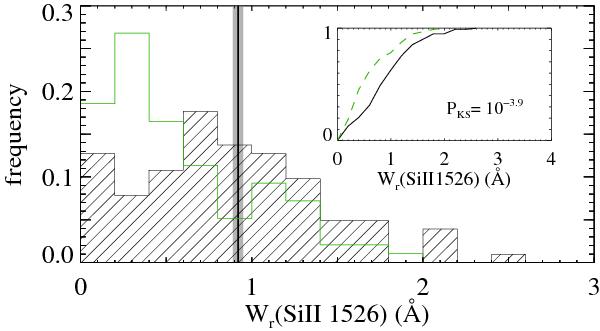
Distributions of the Si ii λ1526 equivalent width measured in ESDLAs (hashed black histogram) and in a sample representative of the overall population of DLAs (green Jorgenson et al. 2013). The vertical line corresponds to the equivalent width (the 1 σ error is represented by the grey area) measured in the stacked ESDLA spectrum. The inset shows the corresponding cumulative distributions (solid black: ESDLAs, dashed green: Jorgenson et al. 2013).
Current usage metrics show cumulative count of Article Views (full-text article views including HTML views, PDF and ePub downloads, according to the available data) and Abstracts Views on Vision4Press platform.
Data correspond to usage on the plateform after 2015. The current usage metrics is available 48-96 hours after online publication and is updated daily on week days.
Initial download of the metrics may take a while.