Free Access
Fig. 3
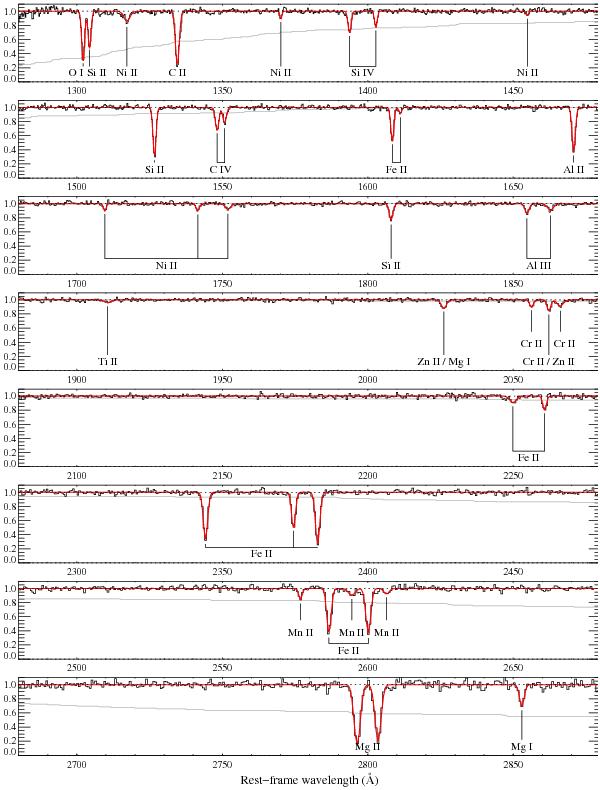
Median ESDLA absorption spectrum redwards of the QSO Ly-α emission. The grey line shows the fraction of the total sample contributing to the stacked spectrum at a given wavelength.
Current usage metrics show cumulative count of Article Views (full-text article views including HTML views, PDF and ePub downloads, according to the available data) and Abstracts Views on Vision4Press platform.
Data correspond to usage on the plateform after 2015. The current usage metrics is available 48-96 hours after online publication and is updated daily on week days.
Initial download of the metrics may take a while.