Fig. 21
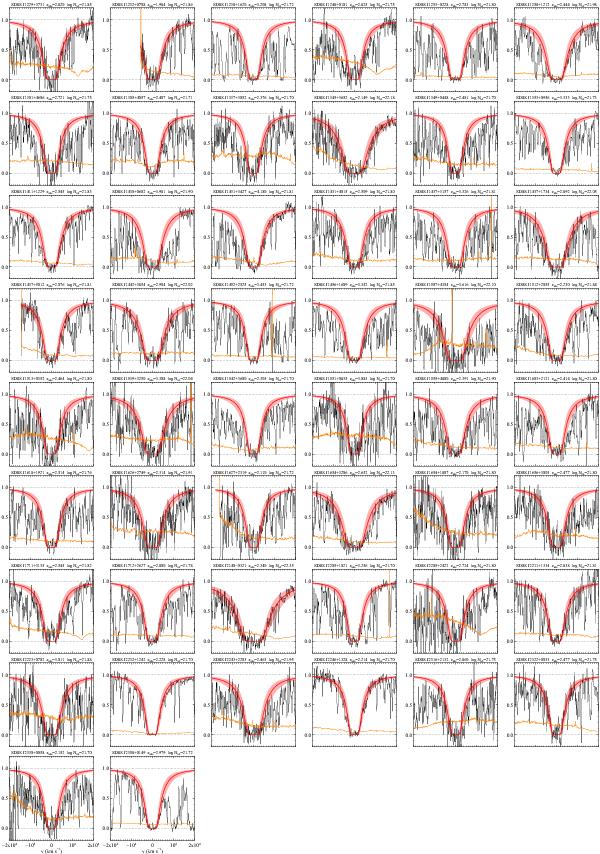
Normalised flux (black, 3 pixel boxcar smoothed) and error (orange) around the damped Ly α line. The Voigt-profile fit is overplotted in red, with the shaded area corresponding to an uncertainty of 0.2 dex. The QSO name, DLA resdshift and H i column density are indicated above each panel.
Current usage metrics show cumulative count of Article Views (full-text article views including HTML views, PDF and ePub downloads, according to the available data) and Abstracts Views on Vision4Press platform.
Data correspond to usage on the plateform after 2015. The current usage metrics is available 48-96 hours after online publication and is updated daily on week days.
Initial download of the metrics may take a while.