Fig. 20
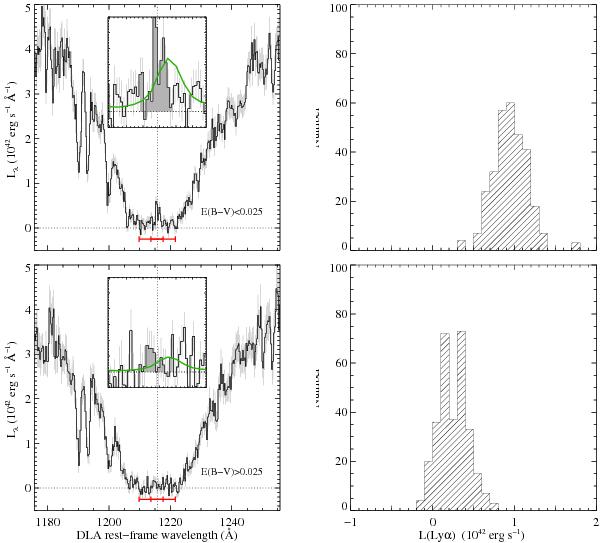
Effect of dust on the Ly α emission. The 3 σ-clipped mean luminosity are represented on the left panels and the corresponding bootstrap analysis on the right panels. The top (respectively bottom) panels correspond to the ESDLA subsample with E(B − V) < 0.025 (respectively E(B − V) ≥ 0.025).
Current usage metrics show cumulative count of Article Views (full-text article views including HTML views, PDF and ePub downloads, according to the available data) and Abstracts Views on Vision4Press platform.
Data correspond to usage on the plateform after 2015. The current usage metrics is available 48-96 hours after online publication and is updated daily on week days.
Initial download of the metrics may take a while.